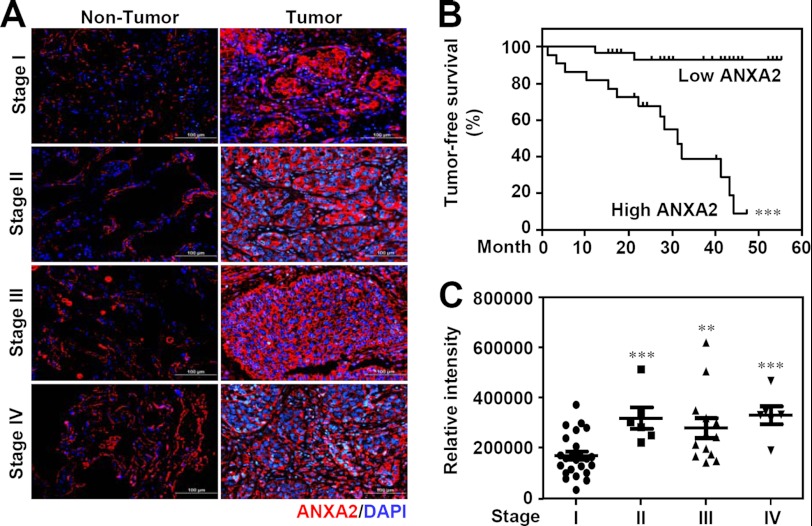
FIGURE 1.
ANXA2 expression in lung tumors and its relationship with survival in patients with NSCLC. A, representative immunohistochemical analysis of ANXA2 (red) in formalin-fixed, paraffin-embedded NSCLC tissues from non-tumor (left) and tumor (right) tissues from clinical stages I, II, III, and IV. DAPI (blue) was used for nuclear staining. Scale bar, 100 μm. B, Kaplan-Meier survival curves of tumor-free lung cancer patients with high ANXA2 (n = 26) or low ANXA2 (n = 28) levels, shown as relative intensities. The differences in the curves were assessed using a log-rank test. ***, p < 0.001. C, comparison of ANXA2 expression with clinical stage progression of NSCLC (stage I, n = 26; stage II, n = 7; stage III, n = 14; stage IV, n = 7). *, p < 0.05; **, p < 0.01; ***, p < 0.001.

