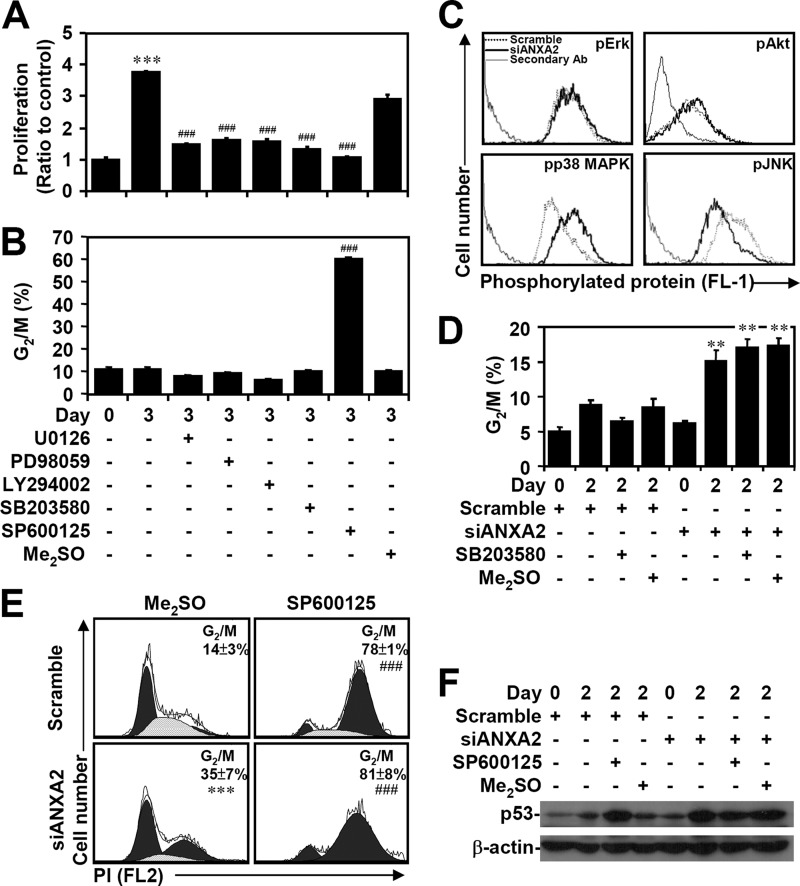
FIGURE 6.
Inactivation of JNK results in G2 arrest caused by ANXA2 deficiency. A549 cells were treated with the indicated inhibitors for 3 days. WST-8 assays (A) and PI staining followed by flow cytometry (B) were used to evaluate cell proliferation and the cell cycle, respectively. The results are shown as the means ± S.D. (error bars) of the -fold change relative to untreated cells or to the percentages of G2/M cells obtained from three cultures. ***, p < 0.001 compared with the untreated group at day 0. ###, p < 0.001 compared with the untreated group at day 3. C, immunostaining was used to determine the expression of phospho-ERK Thr-202/Tyr-204 (pErk), phospho-Akt Ser-473 (pAkt), phospho-p38 MAPK Thr-180/Tyr-182 (pp38 MAPK), and phospho-JNK Thr-183/Tyr-185 (pJNK) in A549 cells with or without scramble or siANXA2 2 days post-transfection. One data set representative of three individual experiments is shown. D, ANXA2 was silenced in A549 cells using siANXA2. Twenty-four hours after transfection, cells were treated with the p38 MAPK inhibitor SB203580 for an additional 24 h. DMSO and scrambled siRNA were used as negative controls. The cell cycle stages were determined using PI staining followed by flow cytometric analysis, and the percentages of G2/M cells are shown as the means ± S.D. from three individual experiments with triplicate cultures. **, p < 0.01 compared with scramble. A549 cells were transfected with siANXA2, incubated for 24 h, and then treated with the JNK inhibitor SP600125 for another 24 h. DMSO and scrambled siRNA were used as negative controls. E, the cell cycle phase was determined using PI staining followed by flow cytometric analysis, and the percentages of G2/M cells are shown as the means ± S.D. from three individual experiments with triplicate cultures. ***, p < 0.001 compared with scramble. ###, p < 0.001 compared with the DMSO group. F, Western blot analysis of p53 expression. β-Actin was the internal control. The data shown are representative of three individual experiments.

