FIGURE 2.
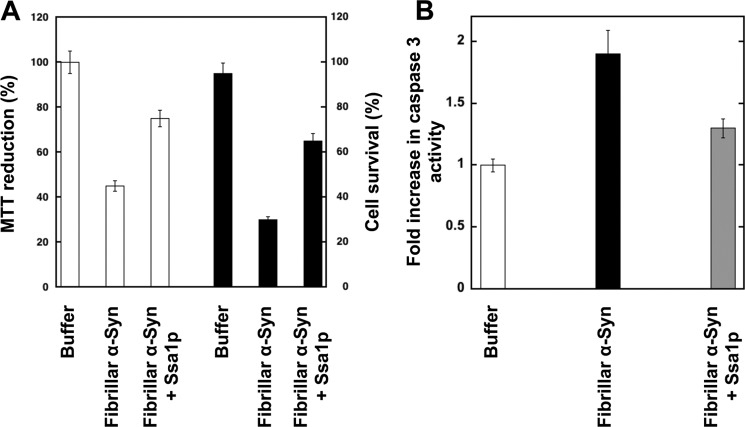
Viability of H-END cells upon exposure to fibrillar α-Syn in the absence or presence of Ssa1p and caspase-3 activation. Before exposure to cells, fibrillar α-Syn (100 μm) was incubated for 1 h at 37 °C with Ssa1p (25 μm). Fibrillar α-Syn was centrifuged for 20 min at 16,100 × g, and the pellet was resuspended in the culture medium to remove unbound Ssa1p. The final protein concentration within the culture medium was 1 μm. A, left axis, cell viability is expressed as the percentage of 3-(4,5-dimethylthiazol-2-yl)-2,5-diphenyltetrazolium bromide (MTT) reduction using cells treated with the same volume of buffer as a reference (100% 3-(4,5-dimethylthiazol-2-yl)-2,5-diphenyltetrazolium bromide reduction) after incubation of the cells with the different proteins for 24 h. The values are mean ± S.E. obtained from three independent experiments. Right axis, proportion of murine endothelioma H-END surviving after exposure to fibrillar α-Syn covered or not by Ssa1p. In the latter measurements, cells lifted by 0.5 mm EDTA were incubated for 20 min in suspension in the presence of naked or Ssa1p coated fibrillar-Syn. The cells were then plated on Petri dishes and cultured for 24 h in the presence of added α-Syn. The surviving adherent cells were then lifted by EDTA, and their number was determined in the presence of trypan blue in four independent experiments using a hemocytometer. B, caspase-3 activation in H-END cells incubated with 1 μm naked fibrillar α-Syn (solid bar) or fibrilar α-Syn pre-incubated with Ssa1p as described above (gray bar). Data are shown as fold increase relative to the caspase-3 activity measured in control cells treated with assembly buffer (white bar). Data are mean ± S.E. (n = 3). *, p < 0.05 (Student's t test).

