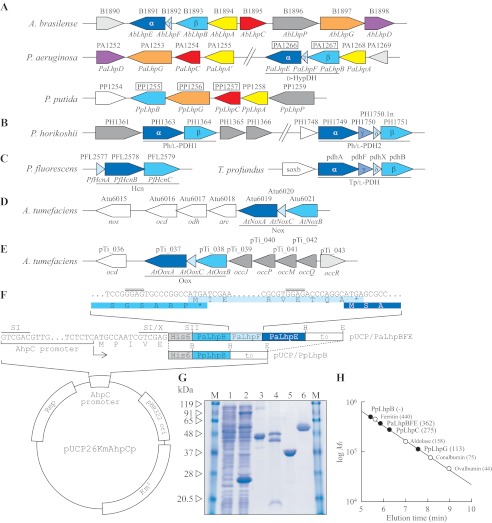
FIGURE 2.
Schematic gene clusters related to l-hydroxyproline metabolism of A. brasilense, P. aeruginosa, and P. putida (A); l-proline metabolism of hyperthermophilic archaea P. horikoshii and T. profundus (B); hydrogen cyanide biosynthesis of Pseudomonas fluorescens (C); and d-nopaline metabolism (D) and d-octopine metabolism (E) of Agrobacterium tumefaciens are shown. The gene cluster of A. brasilense was assumed from the genome sequence of Burkholderia sp. 383 because it is known that both nucleotide sequences around the AbLhpG gene, previously characterized as KGSADH (21), are very homologous. Putative genes in the boxes were purified and characterized in this study (see G). F, plasmid construction for expression of PpLhpB and PaLhpBFE genes in P. putida cells. The inset shows the nucleotide sequence of the PaLhpB, PaLhpF, and PaLhpE genes at the intergenic regions along with the corresponding deduced amino acid sequence (same colors as in A). Rep, replication protein. Putative ribosomal binding sites are indicated by double overlines. SI, X, SII, B, H, and E indicate SalI, XhoI, SacII, BamHI, HindIII, and EcoRI restriction enzyme sites, respectively. G, purification of recombinant PpLhpB (lane 3; 20 μg), PaLhpBFE (lane 4; 50 μg), PpLhpC (lane 5; 20 μg), and PpLhpG (lane 6; 20 μg). Lanes 1 and 2 are cell-free extracts (100 μg) of P. putida KT2442 (parent strain) and KT2442-oxyR1 mutant, respectively, and the major band with a molecular mass of ∼24 kDa is inherent AhpC protein in KT2442-oxyR1 mutant. M represents marker proteins. H, molecular mass determination for PpLhpBFE, PpLhpC, and PpLhpG (closed circles) using calibration obtained with a molecular mass standard (open circles). Values in parentheses are native molecular masses estimated using calibration. The elution profile is shown in supplemental Fig. S1.

