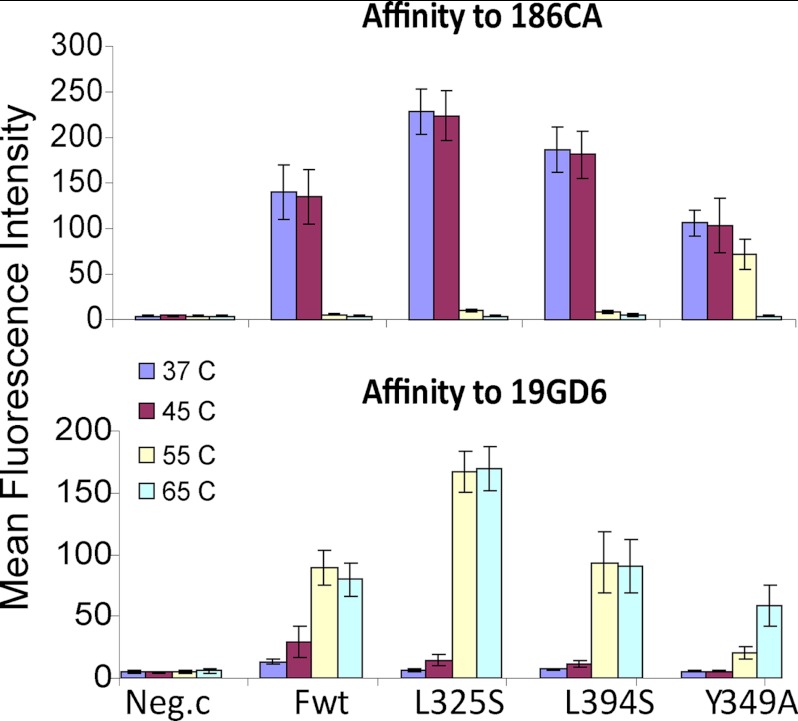
FIGURE 7.
Thermal stability of three F-protein mutants. Cells expressing the proteins indicated at the bottom were exposed to the temperatures indicated on the left for 10 min, fixed, stained, and sorted. Fwt, standard F-protein. Neg.c, empty plasmid. F-protein on the cell surface was detected with conformation-specific antibodies 186CA (top panel) or 19GD6 (bottom panel); fluorescence intensity of individual cells was measured by FACS. The vertical axis indicates mean fluorescence intensity. Mean and standard deviations are indicated on each column. Color coding for temperature exposure is on the left.

