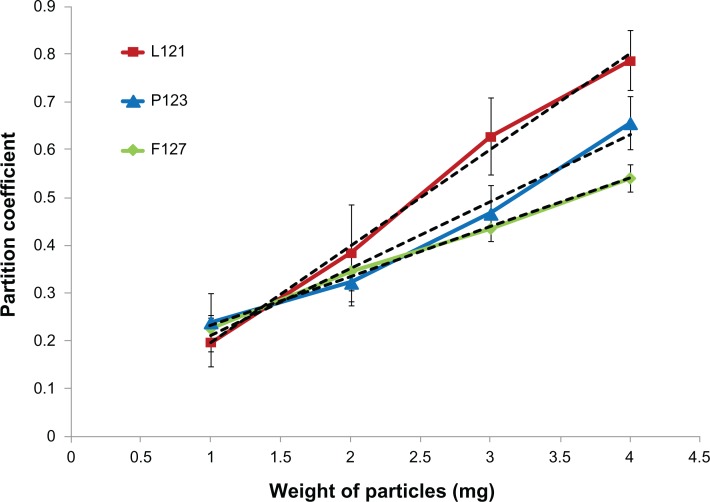
Figure 2.
Plot of partition coefficient (determined by Rose Bengal assay) against weight of microparticles.
Notes: Green: PLGA-F127 (R2 = 0.99, P value = 0.0018); blue: PLGA-P123 (R2 = 0.97, P value = 0.0136); and red: PLGA-L121 (R2 = 0.99, P value = 0.0029) with corresponding linear trend lines (black dotted lines) for slope determination. For values of P < 0.05, the difference is statistically significant.
Abbreviations: PLGA, poly(lactide-co-glycolide); R2, Pearson’s correlation coefficient.

