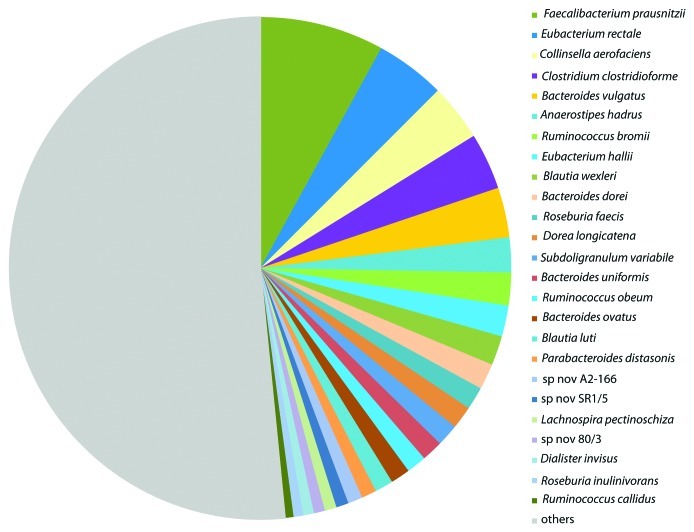
Figure 4. Dominant bacterial species identified by analysis of 16S rRNA sequences in fecal samples from six individuals. Data are from Walker et al. (2011)4 and represent the mean of 26 fecal samples from six obese male volunteers (4, or in one case 6, samples per person) taken during a 12 week controlled dietary study. Phylotypes corresponding to the 25 most abundant cultured bacterial species, that accounted for almost 50% of all sequences, are shown in descending order of abundance on the right hand side. The gray area on the left represents the 295 additional phylotypes (both cultured and uncultured organisms) that were detected.

An official website of the United States government
Here's how you know
Official websites use .gov
A
.gov website belongs to an official
government organization in the United States.
Secure .gov websites use HTTPS
A lock (
) or https:// means you've safely
connected to the .gov website. Share sensitive
information only on official, secure websites.
