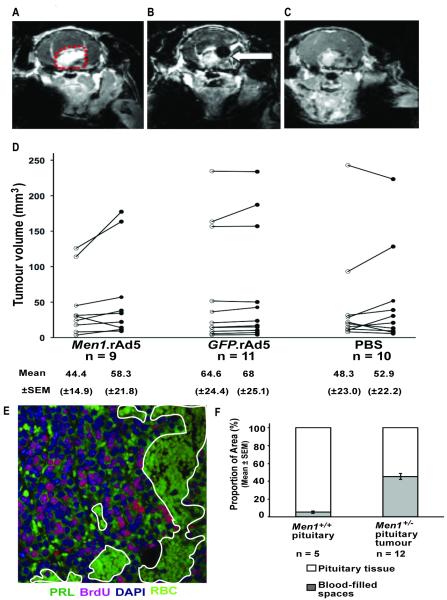
Figure 3. Pituitary tumour imaging and volumetric measurements.
A, Coronal MRI with gadodiamide enhancement, demonstrating a pituitary tumour (outlined in red dots). B, MRI section of the same tumour, immediately after delivery of an intra-tumoural injection; the black area in the brain, shown by the arrow, corresponds to the injected bolus. C, MRI section of the same tumour 24-hours after injection showing complete absorption of the bolus. D, MRI was used to assess tumour volumes, pre-treatment and four-weeks after intra-tumoural injection. Data are shown for each tumour; pre-treatment (open circles), and post-treatment (filled circles). E, Assessment of blood-filled spaces in Men1+/− pituitary tumours. A large area of a pituitary tumour is made up of spaces which are filled with blood (outlined in white, magnification x40). BrdU, 5-bromo-2′-deoxyuridine; DAPI, 4′,6-diamidino-2-phenylindole; PRL, prolactin; RBC, red blood cells. F, Quantification of pituitary sections from wild type mice (n=5) and pituitary tumours from Men1+/− mice (n=12) indicating the proportion of tissue area that is filled by blood-filled spaces (grey bars) compared to pituitary parenchyma cells (white bars).

