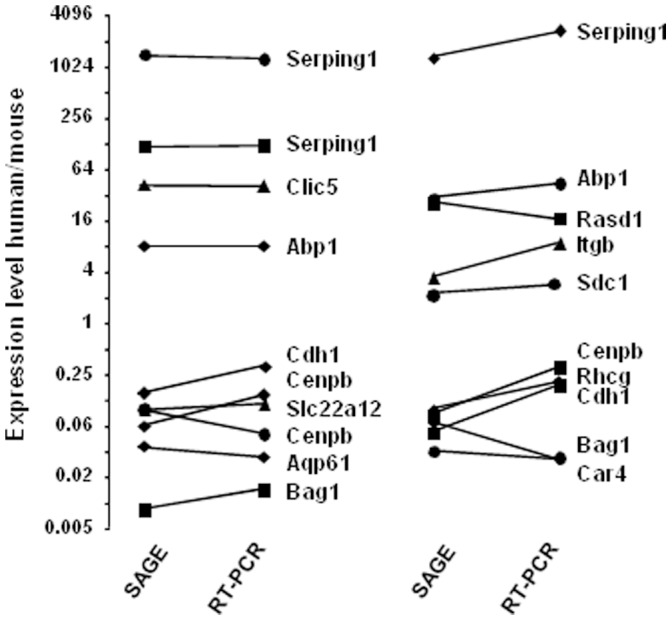
Figure 2. Comparison of gene expression in human and mouse kidney as determined by SAGE and RT-PCR.

Expression of selected genes was determined in the glomerulus (triangles), the S1 segment (circles), the cortical thick ascending limb of Henle’s loop (squares) or the cortical collecting duct (lozenges) by either SAGE or RT-PCR. In both cases, data were normalized to Rplp1 expression. Results were calculated as the human-to-mouse ratio of expression levels (for calculations, a tag occurrence of 0.01 was taken when the tag was not detected). Data are presented according to a base 2 log scale; they were arbitrarily distributed in two panels for legibility purposes.
