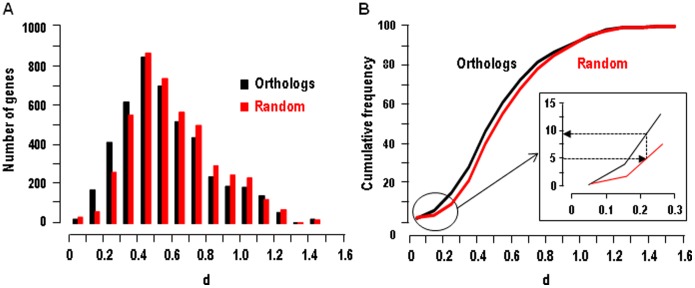
Figure 4. Comparison of gene expression profiles in human and mouse nephron.
A. The columns show the histogram of distribution of the Euclidean distances d of the 4644 pairs of orthologs genes in the HMKS database and of random associated pairs of the same genes. B. Cumulative distribution of Euclidean distances d for pairs of orthologous genes and random-paired genes. The inset shows that 9.3% of orthologous transcripts displayed an Euclidean distance smaller than that of the 5% random pairs of transcripts with the lowest Euclidean distances.

