
Figure 8. Hierarchical and functional clustering of genes with similar expression patterns along human and mouse nephrons.
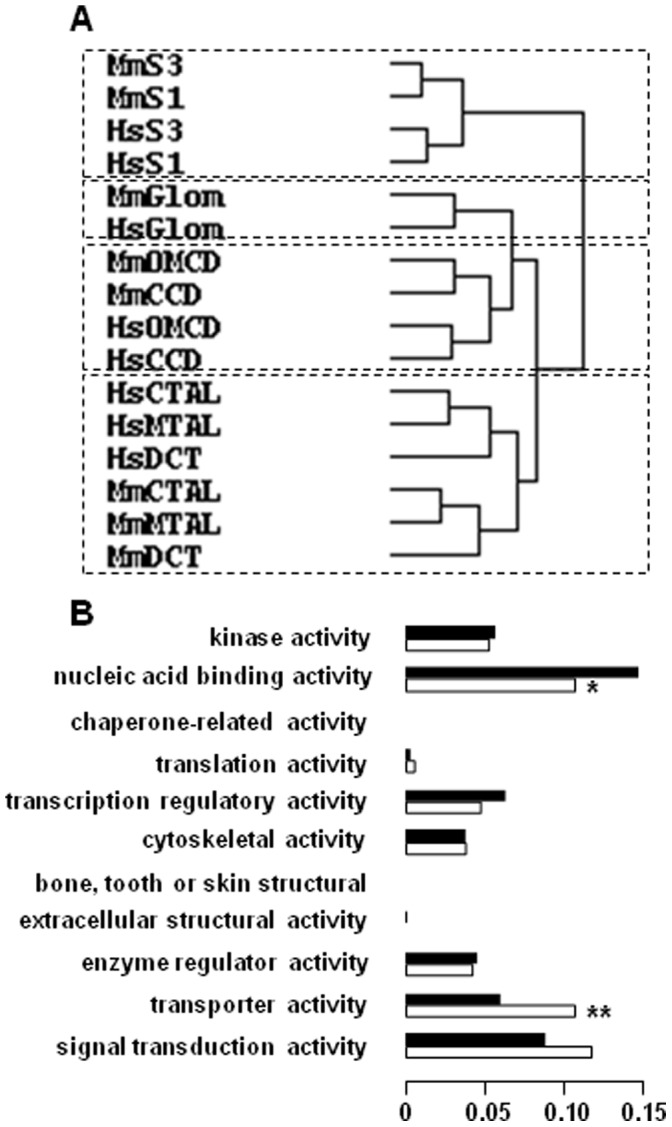
Genes with similar patterns of expression in human and mouse nephrons (i.e., with a Pearson’s coefficient >0.7) were selected within the HMKS database. A. Hierarchical clustering of the 419 selected genes was performed as in figure 4. B. Functional clustering of the 419 selected genes (open bars, see list in Table S2) and all the 4644 genes present in the HMKS database was performed using the GO_Slim Chart Tool at MGI. Data are expressed as fractions of the total number of genes. Values statistically different between the two sets of genes were determined by the chi square test: *, p<0.05; **, p<0.001.