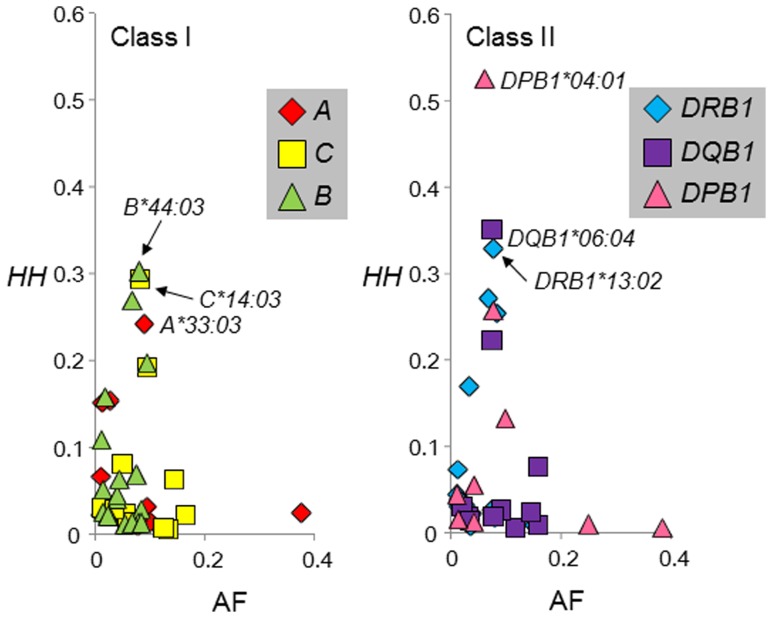
Figure 3. Haplotype homozygosity (HH) × allele frequency (AF) of each HLA allele.
The left and right panels show HH values of HLA class I alleles and HLA class II alleles, respectively. The class I alleles were designated as follows: HLA-A (red diamond), HLA-C (yellow square), and HLA-B (green triangle); the class II alleles were designated as follows: HLA-DRB1 (blue diamond), HLA-DQB1 (purple square), and HLA-DPB1 (pink triangle). In both panels, only HH values of alleles with frequencies of more than 0.01 are shown.

