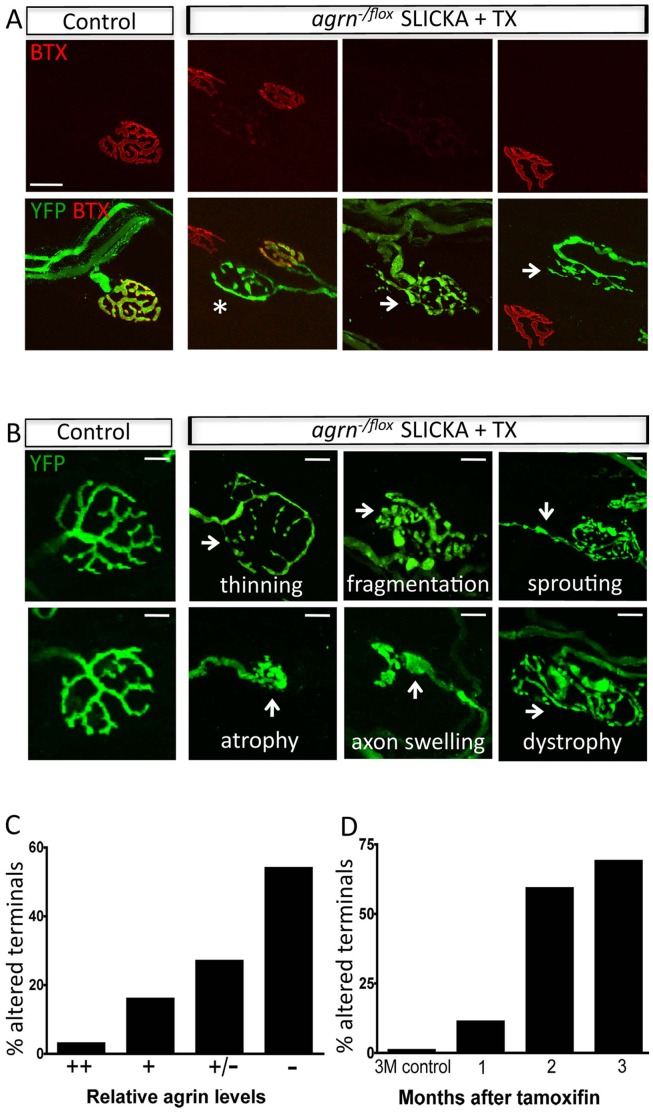
Figure 3. Agrin loss disrupts nerve terminal organization.
A. Variation in nerve terminal morphology at AChR-poor NMJs in agrin mutants. Some terminals appear relatively normal (*) while others show marked dystrophies (arrows). Scale bar = 20 µm. B. Range of presynaptic defects in agrin mutant nerve terminals (arrows). YFP, green. C–D. The terminals that are affected show low levels of agrin relative to those that are unaffected (C), and the percentage of terminals that are altered increases over time (D). n = at least 4 samples per group.

