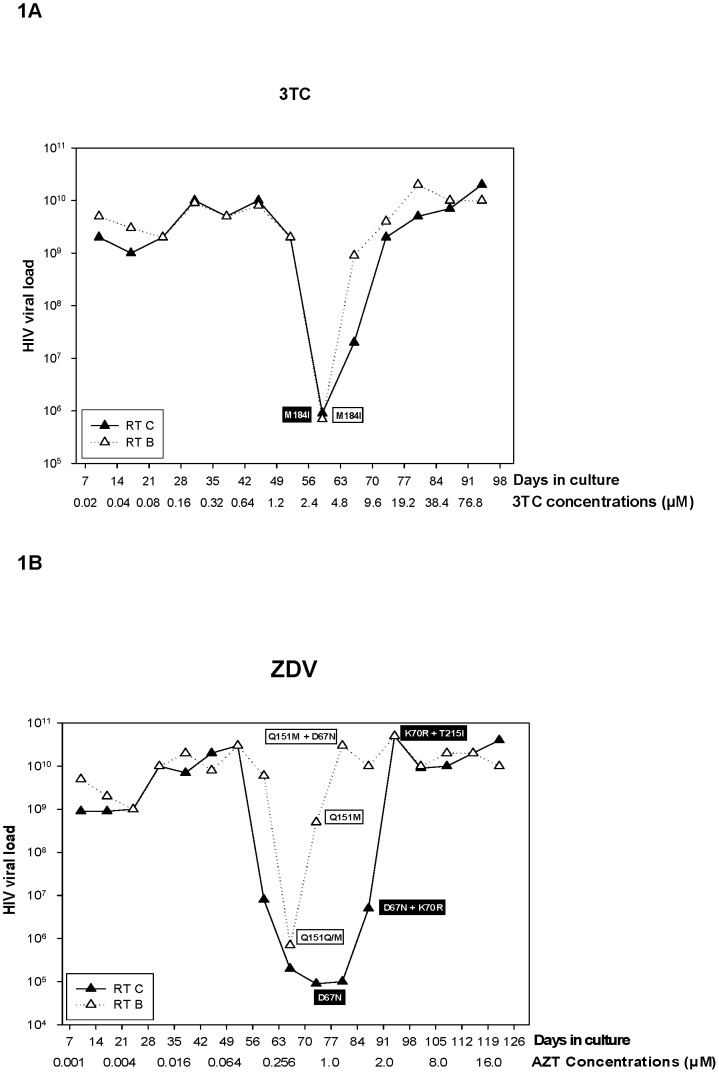
Figure 1. Graphics showing the selection process using 3TC (A) and ZDV (B) in MT4 cells infected with recombinant HIV-1 clones carrying the RT gene from subtype B and C.
The virus load measured through real-time PCR from the culture supernatant is depicted on the y-axis. The time and concentration of the drugs utilized in each virus passage during the selection process are shown on the x-axis. Drug resistant mutations found in the clones during the passages are shown in the boxes below the curves. The white boxes contain mutations found in subtype B, and the black boxes contain the mutations found in subtype C.

