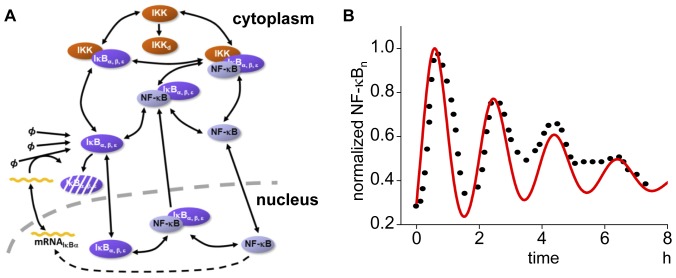
Figure 1. Schematic view of the temporal model and its simulation result.
(A) The model includes IKK activation, subsequent phosphorylation and proteosomal degradation of inhibitory protein IκBα, IκBβ, and IκBε, activation of NF-κB, and its translocation to nucleus where a gene for IκBα is expressed in the NF-κB-dependent manner. (B) The simulated oscillation of the temporal model (red line) and an experimental observation by Sung, M.L. et al., PLos ONE, 2009 [25] (dots) are shown. The concentration of nuclear NF-κB (NF-κBn) is normalized to the maximum value.

