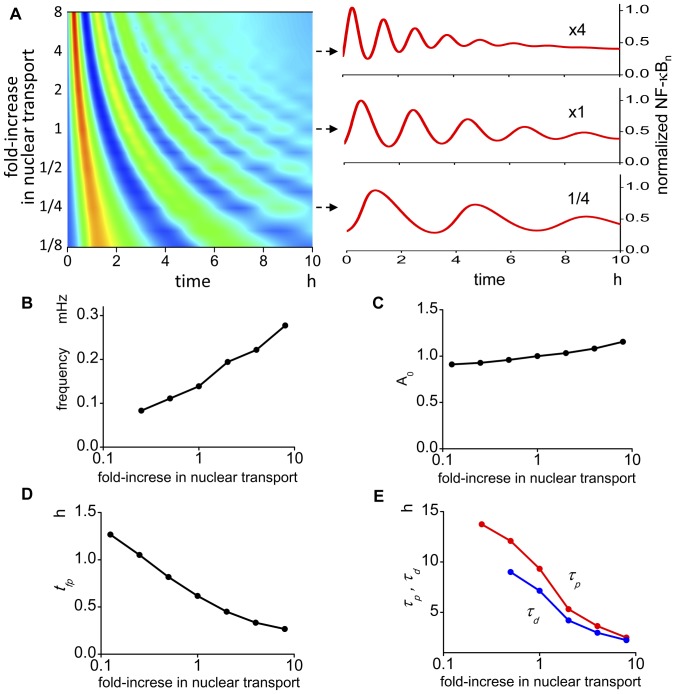
Figure 4. The oscillation pattern is altered by the change in the nuclear transport.
(A) There is a large change in the oscillation pattern by the change in the nuclear transport. Representative oscillations are shown in the right panels. (B) Oscillation frequency becomes larger as transport increases. (C) The amplitude of the first peak becomes larger at larger transport values. (D) The time to the first peak changed largely by the change in the transport. (E) τp and τd also show large change by the change in the transport. These data are not available at smaller nuclear transport values.

