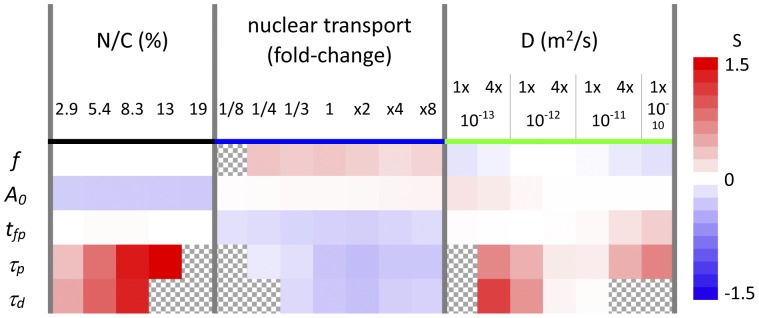
Figure 7. Sensitivity of each characterizing parameter by the change in the spatial parameters.
Sensitivities for the five characterizing parameters of f, A0, tfp, τp, and τd to each spatial parameters, which are calculated by Eq.1, are shown (see Materials and Methods). Red and blue cells indicate positively and negatively large sensitivities, while white cells indicate that the characterizing parameter is not sensitive to the change in the corresponding spatial parameter. Hatched regions indicate no available data.

