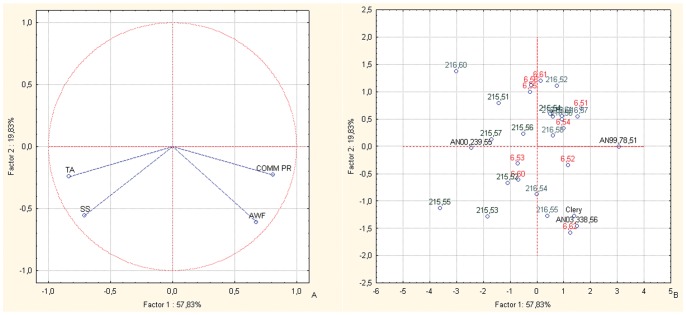
Figure 6. Principal component analysis.
Bi-plot of the fruit weight, commercial production, TA and SS content parameters of the selections and the corresponding parents of the BC2 back-cross populations. Factor 1 and Factor 2 explain 78.66% of the data variation. a: Variable vector distributions; b: Case distributions. The seedlings reported in the PCA are identified only with the codes related to the cross combinations and the progressive seedling numbering.

