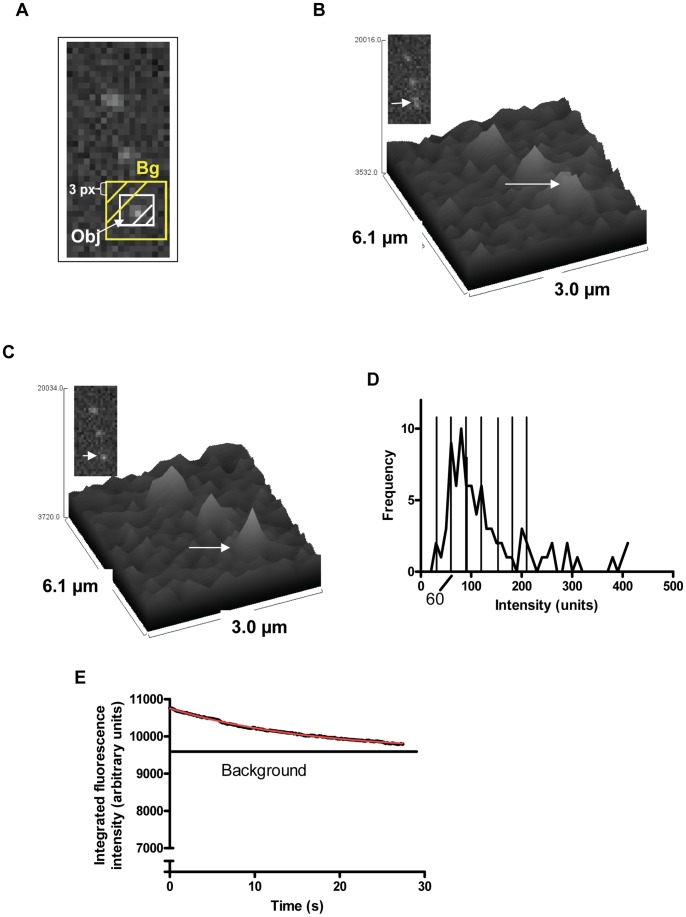
Figure 1. Fluorescence intensities attributed to Rh-rIgG after complex-formation with (a-rIgG) conjugated actin filaments.
Observation using epi-fluorescence microscopy (TRITC filter set) and an EM-CCD camera with high gain after binding of the filaments (in the absence of ATP) to HMM on a surface. (A) Regions of interest “Bg” (yellow rectangle) and Obj (white rectangle) used to estimate background-subtracted intensity of diffraction limited fluorescent spot as described in the text. The Bg-rectangle is 3 pixels (0.165 µm/pixel) wider than Obj-rectangle. Same data as inset of Fig. 1C. (B) Surface plot illustrating spatial intensity distribution attributed to four fluorescent spots (inset) along one actin filament. The spot indicated by the arrow, exhibited photo-blinking, and is “on” in this image frame. (C) Same filament as in (A) observed 0.6 s later with disappearance of fluorescence spot at arrow due to blinking. Total observed drop in intensity: 70 intensity units (IntU). (D) Frequency polygon (bin width: 10 IntU) for fluorescence intensities of apparently isolated fluorescent spots (in total 87, observed in the given experiment). Vertical straight lines separate 30 IntU suggested to represent a single fluorophore as argued in the text. (E) Photobleaching of Rh-rIgG. The decay in fluorescence intensity during an observation period integrated over the entire image with Rh-rIgG bound to a-rIgG on actin filaments and non-specifically on the surface. The background level was obtained from fit (red line) of single exponential decay function (decaying to background level >0) to experimental data (black curved line).

