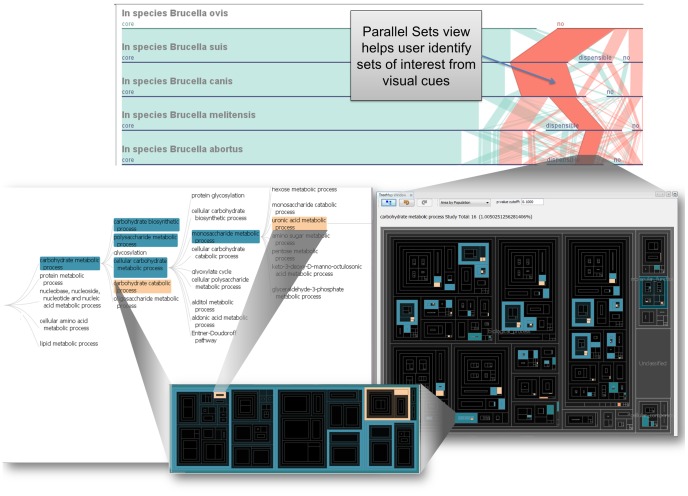
Figure 4. Application example of using GenoSets to identify key features of interest.
(A) Parallel Sets highlights sets of interest that can be further analyzed using multiple alternative views. (B) GO Treemap view showing all GO terms, with the colors representing the enriched terms. If the term ratio is higher for the study set than the population set, the term is colored rose; otherwise, the term is colored blue. (C) The treemap is filtered to display carbohydrate metabolic process and all of this term’s children. (D) The GO Tree Navigator view can aid the user in navigating the GO tree hierarchy. All of the views are coordinated with one another such that selection in one view is propagated to all others.

