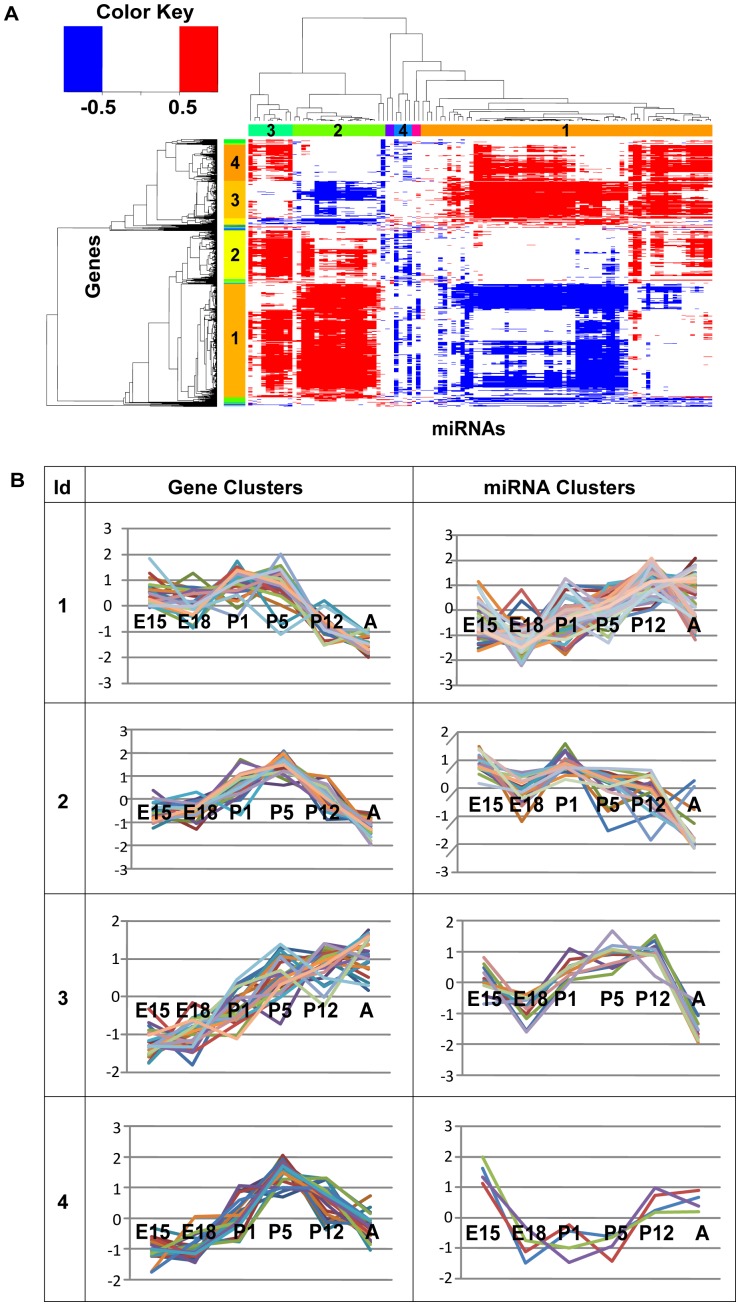
Figure 1. Expression correlations and clusters of miRNAs and genes.
(A) Expression correlations between genes and miRNAs in the developing mouse retina. Rows represent protein-coding genes and columns represent miRNAs. Only the high correlations, bigger than 0.5(red) and less than −0.5(blue), are colored. The cluster IDs of gene and miRNA clusters are shown on each axis. (B) Gene and miRNA clusters. Relative expression of the 4 biggest clusters for genes and miRNAs throughout the developmental time points. Y-axis is the expression level in log2 scale. Each line in the clusters represents one gene.

