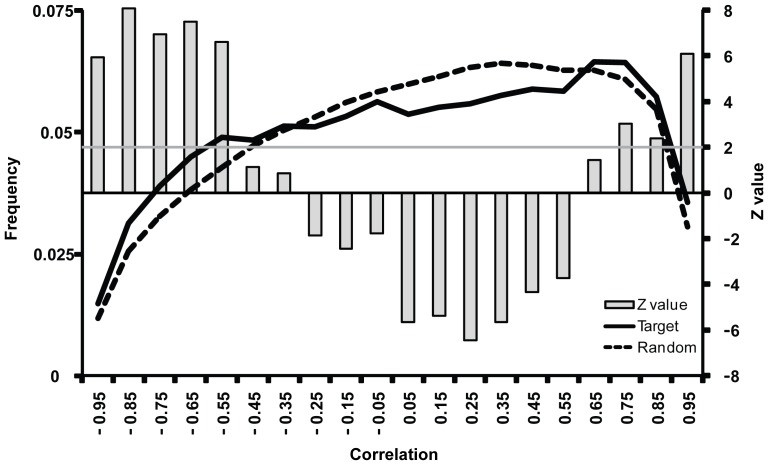
Figure 2. Expression correlations between miRNAs and their predicted targets.
The distributions for the predicted targets in TargetScan database (solid) and for the random targets (dot) are shown. The column plot represents the Z-values of each interval against 1000 miRNA target randomization on the right Y-axis.

