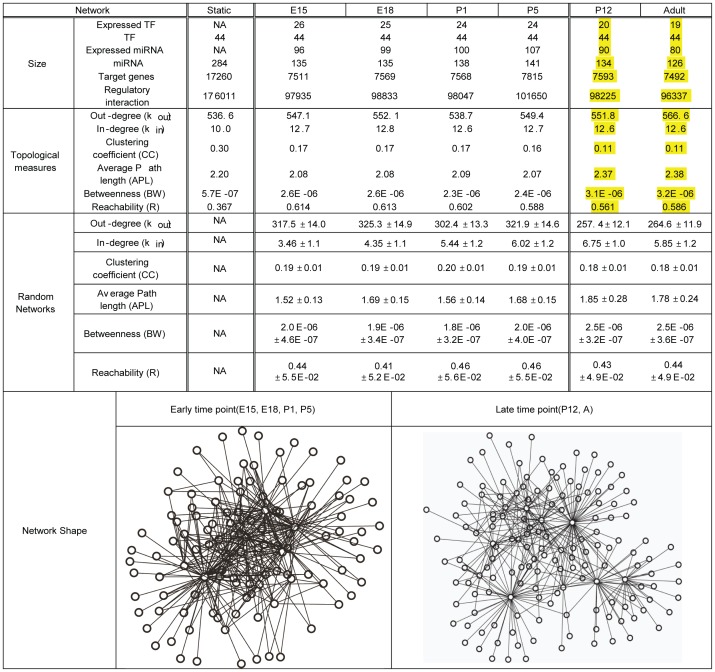
Figure 4. Topological measures of the static and active networks of six time points.
Out-degree is the number of regulated genes by a TF or miRNA. In-degree is the number of regulating TFs or miRNAs of a target gene. Clustering coefficient measures the inter-connectivity around a node. Average path length is the average length of all shortest paths among all node pairs. Betweenness is the average number of shortest paths between all node pairs passing through a node. Reachability is the fraction of nodes that can be reached from a node in the network. The mean and standard deviation (mean±SD) of 300 random networks for each time point are presented in Random Networks row. Examples of early and late time point active sub-networks are illustrated in the last row.

