
Figure 2. Effect of number of samples and expression intensity on the number of reconstructed isoforms.
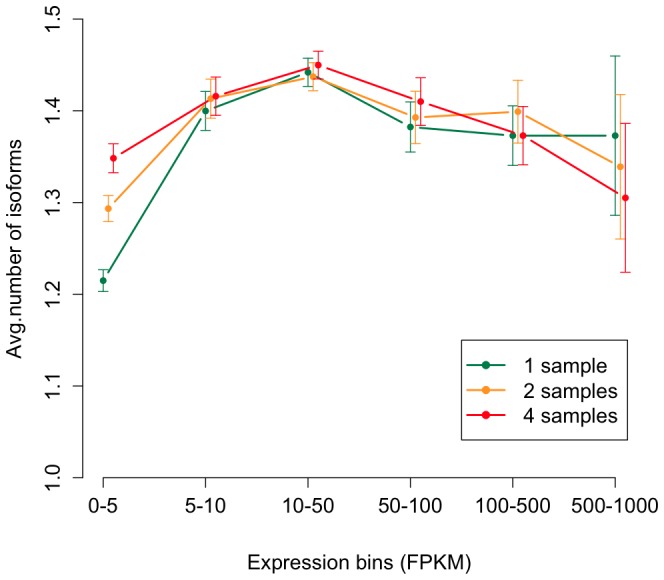
Isoform reconstruction is performed with TopHat-Cufflinks using one sample (ps94 males), two samples (ps94 males + ps94 females) and all four samples On the x-axis FPKM = Fragments per Kilobase of exon per Million fragments mapped, on the y-axis the average number of reconstructed isoforms is reported. Adding samples increases the amount of predicted isoforms only for low and moderate expression levels.