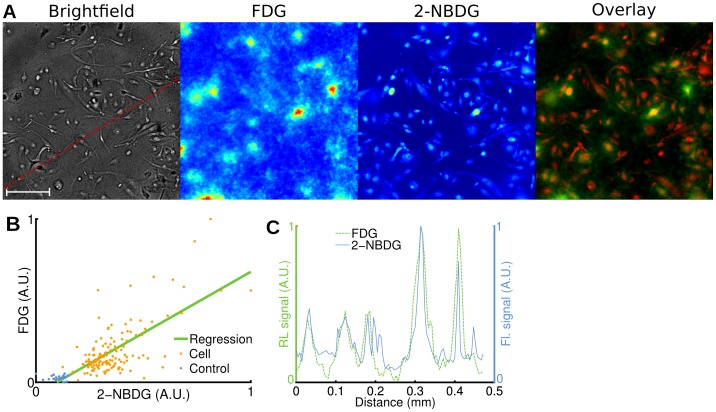
Figure 2. Radioluminescence imaging of FDG uptake in single cells.
Human breast cancer cells (MDA-MB-231) were deprived of glucose for 1 h, incubated for 1 h with FDG (400 µCi) and 2-NBDG (100 µM), and then washed. (A) Brightfield (scale bar, 100 µm.), radioluminescence (FDG), and fluorescence (2-NBDG) micrographs (Objective: 40X/1.3 NA). Overlay, showing co-localized radioluminescence (green) and fluorescence (red). (B) Scatter plot comparing FDG and 2-NBDG uptake, computed over 140 cells (light red dots) and 26 control ROIs (blue dots). The green line was obtained by linear regression (correlation, r = 0.74). Arbitrary units (A.U.). (C) Radioluminescence (FDG) and fluorescence (2-NBDG) intensity shown along a line profile [red dashed line in (A)].

