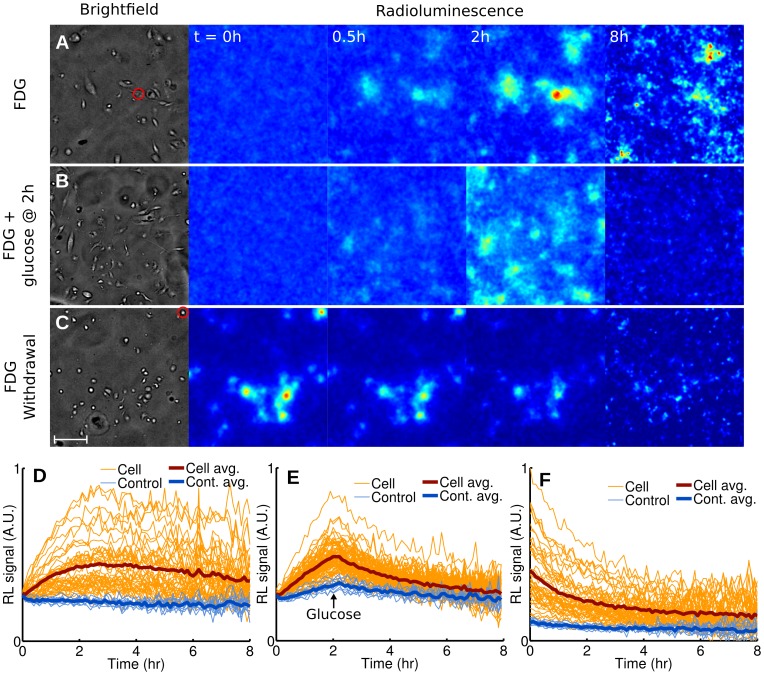
Figure 3. Dynamic radioluminescence imaging of FDG in single cells.
Micrographs (brightfield and radioluminescence) were acquired every 6 min for 8 h for three experiments. (A) MDA-MB-231 cells are imaged while being incubated with FDG (5 µCi). (B) Glucose (25 mM) is added 2 h after the beginning of the incubation with FDG (5 µCi). (C) FDG is withdrawn at the start of imaging after incubation (1 h, 400 µCi). Scale bar: 100 µm. (E–F) Time-activity curves plotted for individual cells (light red lines) and 10 control ROIs manually selected in the background (light blue lines), for all three experiments. The thick red and blue lines represent the average for cells and control ROIs, respectively.

