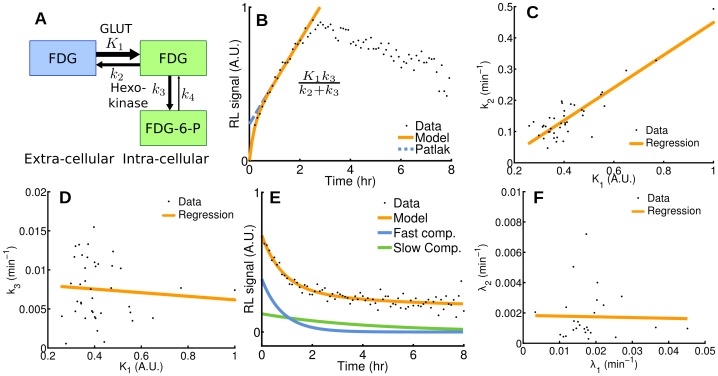
Figure 4. Pharmacokinetics analysis in single cells.
(A) Two-tissue compartmental model describing FDG pharmacokinetics, including influx (K 1), efflux (k 2), phosphorylation to FDG-6-phosphate (k 3), and dephosphorylation (k 4). (B) Patlak analysis modeling FDG influx kinetics for a single cell (highlighted by a red circle in Figure 3A). (C,D) Rate of efflux (k 2) and phosphorylation (k 3) plotted as a function of rate of influx (K 1) for all the cells in the microscope’s field of view. (E) Compartmental analysis modeling FDG efflux kinetics from a single cell (highlighted by a red circle in Figure 3C) after withdrawal of FDG, presenting a fast and a slow component. (F) The model for FDG efflux is the sum of a fast and a slow component (rates λ 1 and λ 2, respectively), which are plotted for all the cells in the field of view.

