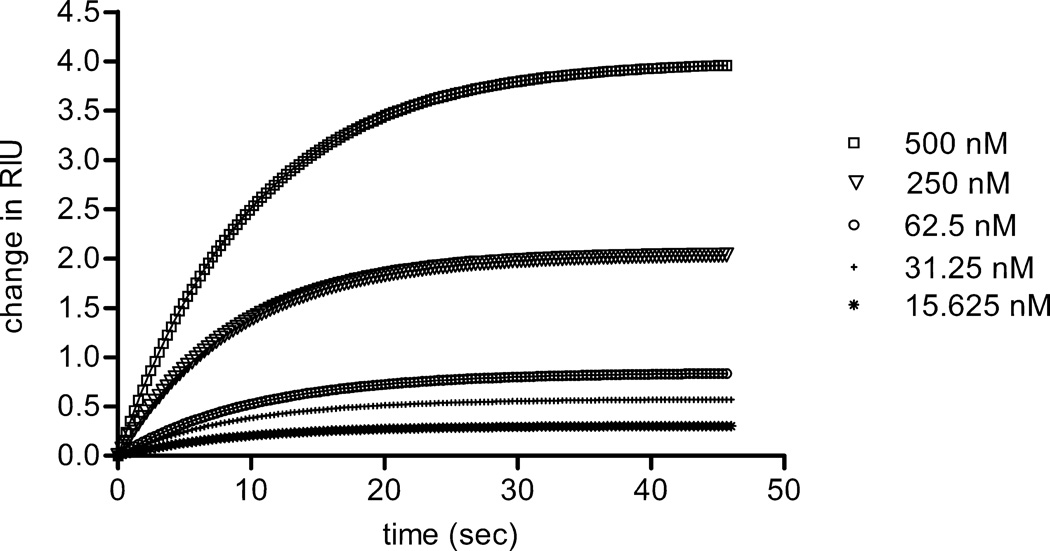
Figure 6.
Interaction between thrombospondin 1 and the NTD of α1(XI) collagen was analyzed by surface plasmon resonance. Collagen α1(XI) NTD was covalently coupled to the sensor chip, while thrombospondin 1 at concentrations ranging from 15 to 500 nM was allowed to bind to the Collagen α1(XI) NTD. The average of 3 runs to collect association data is shown. Using the data shown to fit to a steady state affinity model, the dissociation constant (Kd) was calculated to be 100nM for native thrombospondin 1, assuming a one-site association model.

