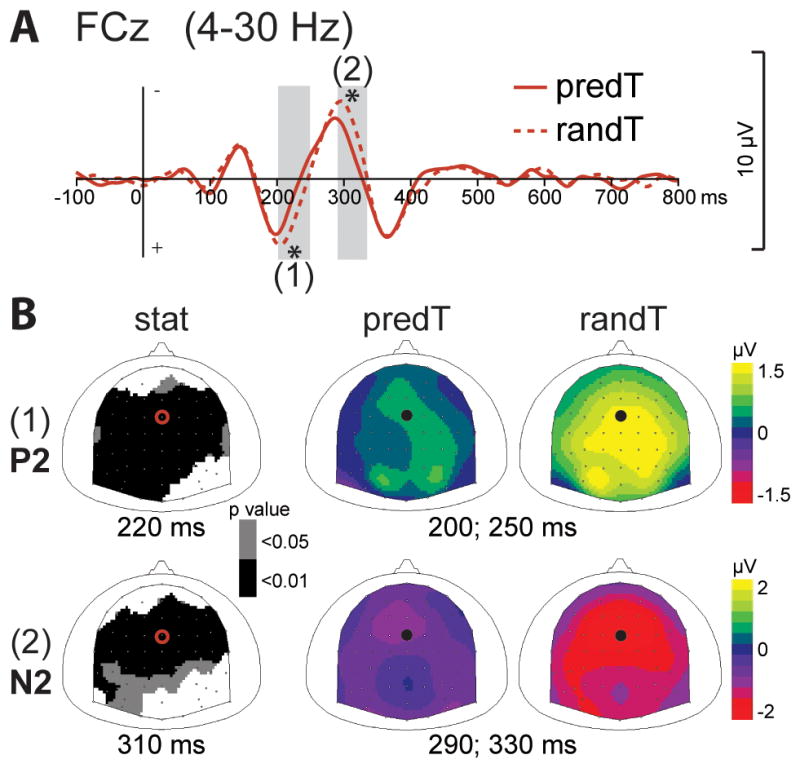
Fig. 5. Effect of predictive context on early ERPs to targets.

(A) Grand-average ERP waveforms band-pass filtered between 4 and 30 Hz, at FCz electrode. ERPs to the predicted (predT) and random (randT) targets are depicted with full and dashed red lines, respectively. Time-windows showing significant difference between the 2 conditions are indicated by grey bars (*: p < .01). (B) Scalp topographies (top views) of the early P2 (1) and N2 (2) ERPs. Left column: topographies of the p-value resulting from permutation tests at the latency of the maximal difference (220ms for P2, 310msec for N2). Right columns: topographies of the mean ERP values in the time-windows indicated by grey bars in (A). The black dots and red circles indicate the position of the FCz electrode.
