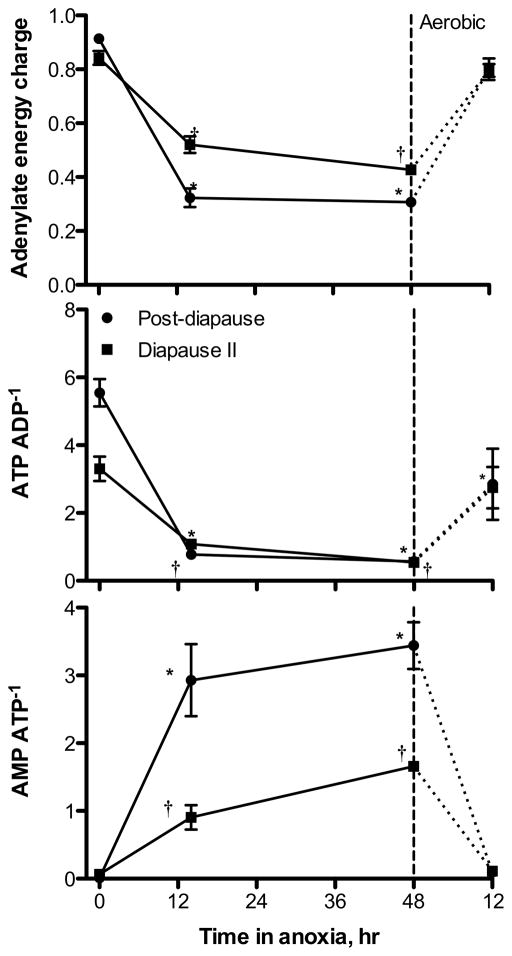
Fig. 4.
Measures of energetic status for embryos of A. limnaeus exposed to anoxia followed by 12 h of aerobic recovery. Symbols are means ± s.e.m. (n = 3). Statistically significant differences from values at t = 0 are indicated by a * for post-diapause II, and a † for diapause II embryos (ANOVA, Dunnett’s post hoc, p < 0.01).

