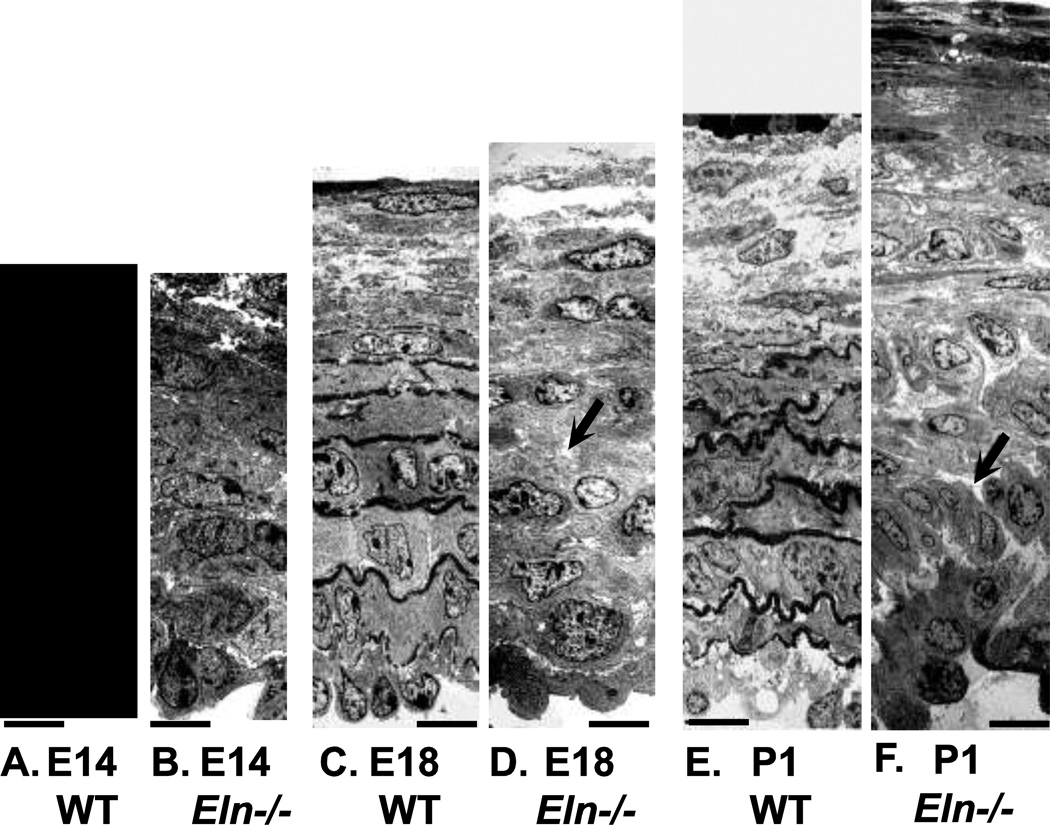
Figure 1.
EM images of WT and Eln−/− mouse aorta at E14, E18 and P1. At E14, WT (A) and Eln−/− (B) aorta look similar, with 6 – 7 layers of circumferentially oriented SMCs. WT E14 aorta has small deposits of elastin (arrow) between cell layers. At E18, WT (C) and Eln−/− (D) aorta still look similar with organized layers of circumferentially oriented SMCs. WT E18 aorta has large deposits of elastin between layers, while Eln−/− E18 aorta has large white spaces (arrow) that are most likely proteoglycans, which do not take up the dark EM stain. At P1, WT (E) aorta has adundant elastin between layers of circumferentially oriented SMCs. At P1, Eln−/− (F) aorta has disorganized SMCs that have lost their circumferential orientation (arrow) and cell-cell contacts and have begun overproliferating. Panels E and F modified from Wagenseil et al. (2009). Scale bars = 11 µm.

