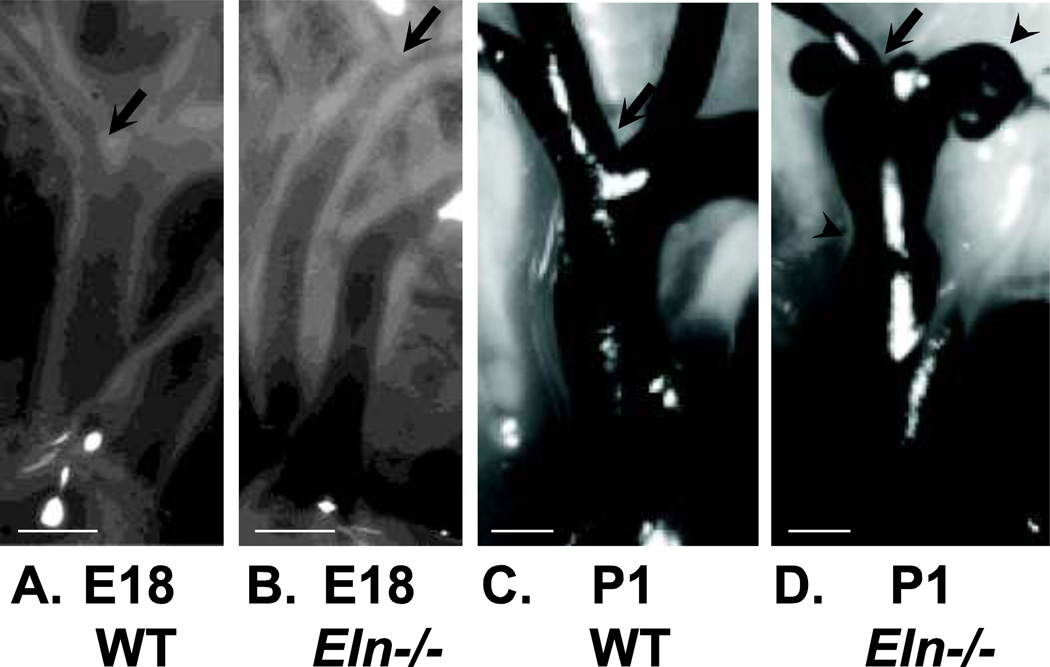
Figure 4.
Images of the ascending aorta and its major branches in E18 and P1 WT and Eln−/− mice. The arrow in all panels shows the location of the first branch. At E18, the Eln−/− (B) aorta is smaller in diameter and longer in length than WT (A), but shows no other major morphologic differences. At P1, the Eln−/− (D) aorta is still smaller in diameter and longer in length than WT (C), but also shows severe stenoses and dilations (arrowheads). In the P1 images, india ink was injected into the arteries to improve contrast. Modified from Wagenseil et al. (2009, 2010). Scale bars = 300 µm.

