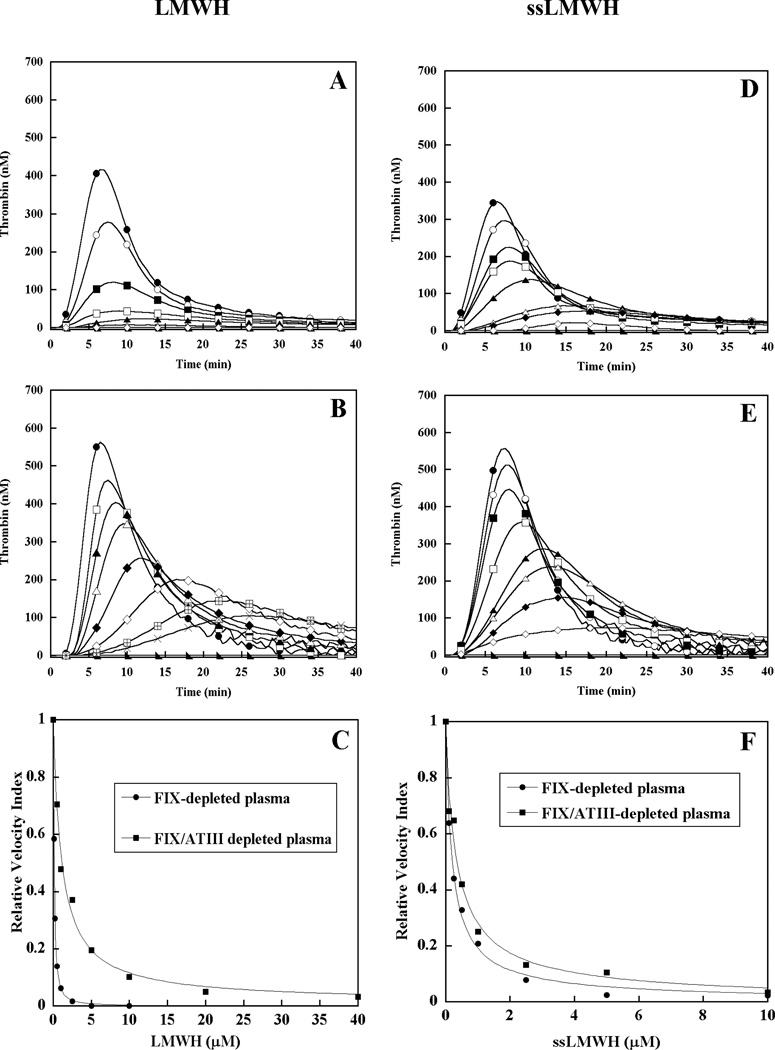
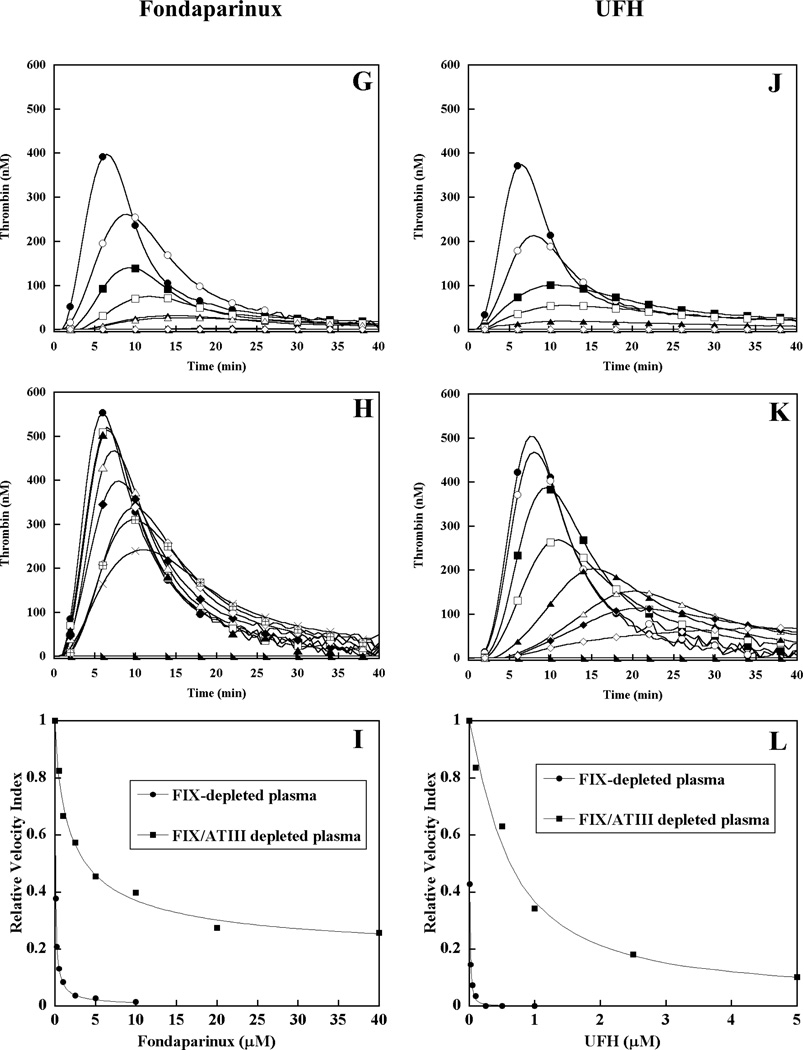
Figure 3. Effect of heparins on thrombin generation triggered by limiting tissue factor in factor IX- or factor IX/antithrombin-depleted plasma supplemented with 100% plasma-derived factor IX.
Thrombin generation was initiated with 0.2 pM human tissue factor (TF), 8.3 µM PC:PS vesicles, and 40 µg/ml CTI (plasma concentrations) in FIX- (panels A, D, G, J) or FIX/ATIII- (panels B, E, H, K) depleted plasma supplemented with 90 nM plasma-derived factor IX in the presence of increasing heparin concentrations. LMWH, ssLMWH, and Fondaparinux concentrations were 0 (●), 0.1 (○), 0.25 (■), 0.5 (□), 1 (▲), 2.5 (Δ), 5 (◆), 10 (◇), 20 ( ), and 40 µM (X). UFH concentrations were 0 (●), 0.01 (○), 0.1 (■), 0.025 (□), 0.05 (▲), 0.1 (Δ), 0.25 (◆) and 1 µM (◇) in factor IX-depleted plasma; and 0.1 (○), 0.5 (■), 1 (□), 2.5 (▲), 5 (Δ), 10 (◆) and 20 µM (◇) in factor IX/antithrombin-depleted plasma. Controls included no TF/plasma-derived FIX (►) in the absence of heparin. The time course of thrombin generation was measured as described in Material and Methods. Thrombin generation curves represent the mean thrombin concentration over the first 40 min from replicate determinations (n=3), with individual curves identified by representative points. The relative velocity index for thrombin generation was plotted versus heparin concentration for each condition, and fitted as described in Materials and Methods to determine the EC50 for inhibition (panels C, F, I, L). Representative curves are presented, with the UFH curve truncated to allow better comparison.


