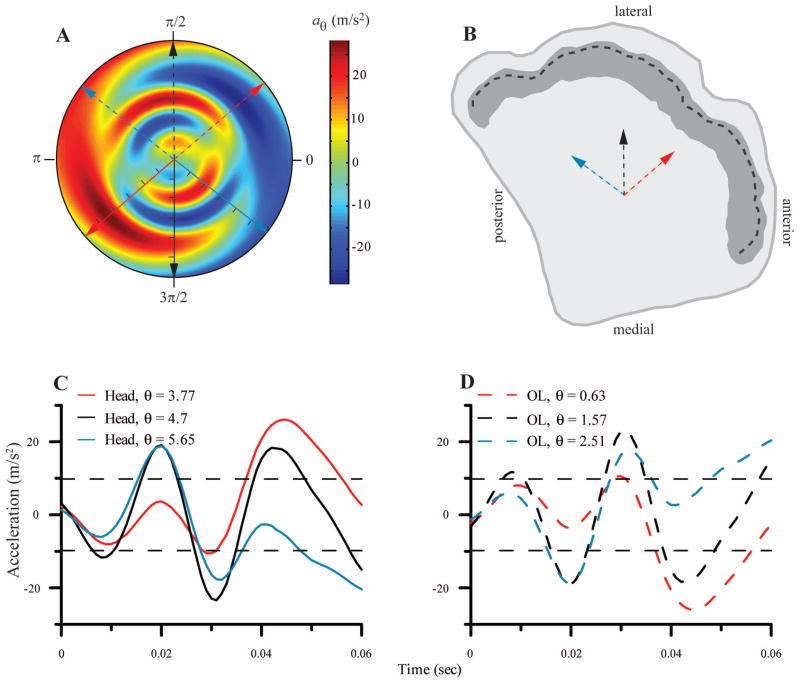
Fig. 6.
A. Composite view of the acceleration profile in the plane of the OL in polar form. The radial axis is time and the angular axis is θ (in radians), the direction relative to x-axis of the U- frame, where 0 corresponds to anterior in anatomical coordinates, and positive is counterclockwise. Solid arrows represent 3 direction vectors for which the time course of head acceleration components in the plane of the OL is calculated (tic marks on solid arrows at 10 msec intervals). The dashed arrows represent the direction of forces applied to the OL for the same movements. B. A schematic view of the surface of the left utricle. The dark shading represents the striola, and the heavy dashed line indicates the line of polarity reversal. The dashed arrows represent hair cells whose excitatory bundle orientation matches the correspondingly colored dashed arrows in A. C. The time course of the head acceleration components in the plane of the OL is shown for the three directions indicated by the correspondingly colored solid arrows in A. D. The time course of the acceleration components applied to the OL for the three directions indicated by the correspondingly colored dashed arrows in A and B. Horizontal dashed lines in C and D represent + and −1g. Legend values in C and D indicate direction in radians.

