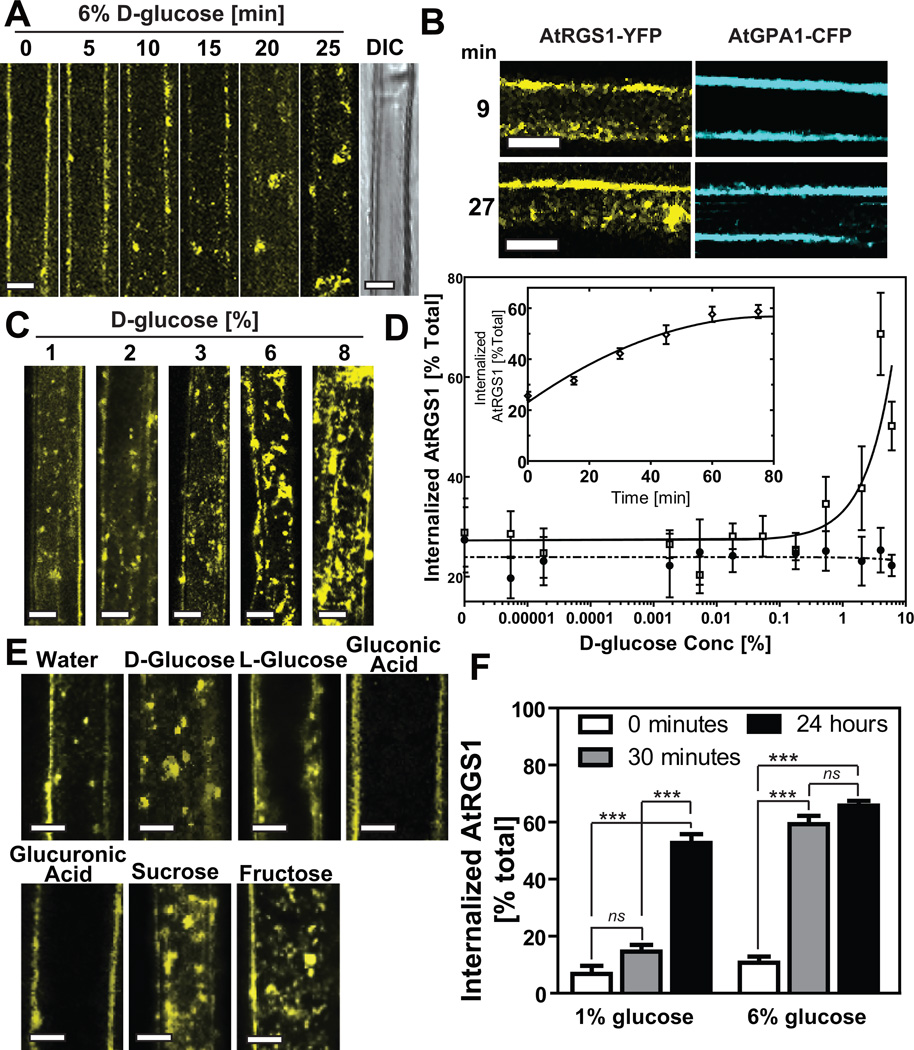
Figure 1. AtRGS1 internalizes in response to sugar.
AtRGS1-YFP internalized by glucose. (A) AtRGS1-YFP and (B) AtGPA1-CFP localization after treatment with 6% glucose in an Arabidopsis hypocotyl epidermal cell. Differential interference contrast (DIC) shows that 30 min of glucose does not disrupt cell integrity (last in series, panel A). (C) Dose-dependent internalization of AtRGS1. Arabidopsis cells stably expressing AtRGS1-YFP imaged after treatment with varying concentrations of glucose for 30 min. (D) Quantitation of dosage response of AtRGS1 (open square) and AtRGS1(E320K) mutant (GAP dead; close circle) with increasing glucose concentrations. At the 30 min time point, YFP fluorescence was measured by subtracting internalized RGS1-YFP fluorescent signal from total cell fluorescence. A point mutation that inhibits AtRGS1 interaction with AtGPA1, AtRGS1(E320K), disrupts AtRGS1-YFP internalization. Error bars = SEM, n = 5. (D Inset) Quantitation of the glucose dosage response of AtRGS1-YFP internalization imaged at 30 min post-glucose treatment. Error bars = SEM, n = 5. (E) Sugar specificity of AtRGS1 internalization. Several sugar and sugar analogs (6% of each) were applied to seedlings expressing AtRGS1-YFP for 30 min prior to imaging as described in Methods. (F) RGS1-YFP reciprocity of time and dose dependence. AtRGS1 seedlings stably expressing AtRGS1-YFP were treated without or with 1% or 6% D-glucose. After 30 min or 24 hr treatment, internalized AtRGS1 was quantified. Error = SEM, n = 5. Labels with ns has no statistical difference (P > 0.05), *** mean highly significantly different (P < 0.001). All scale bars = 10 µm. Quantitation of fluorescence is described in Methods.

