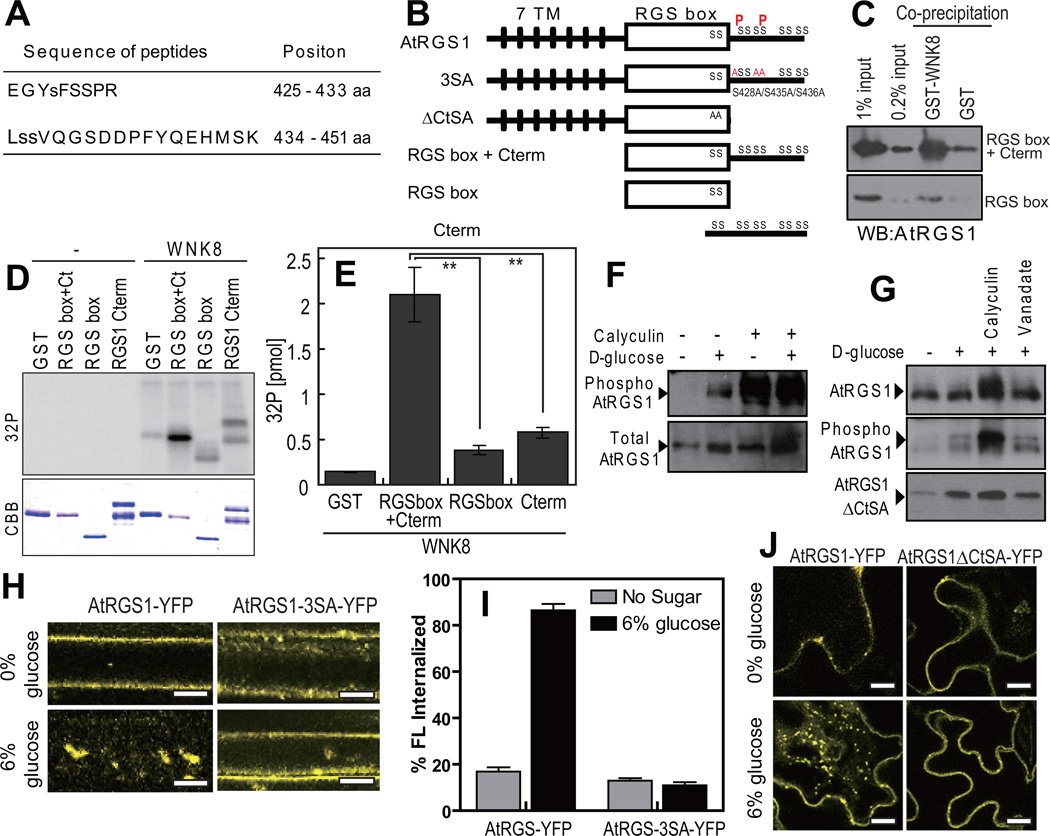
Figure 4. Phosphorylation and function of the carboxyl terminus of AtRGS1.
(A) Phosphorylated peptides of AtRGS1 isolated and identified by tandem mass spectrometry. Recombinant RGSbox+Cterm was phosphorylated by AtWNK8, trypsinized and subjected to LC-MS/MS as described in the Methods. (B) Schematic model of AtRGS1 mutants. Transmembrane regions are shown as black lines, AtRGS1 box as a white box and the identified phosphorylation sites are denoted “P”. (C) In vitro binding between AtRGS1 truncated mutants and AtWNK8. Recombinant RGSbox+Cterm or RGSbox of AtRGS1 was tested for interaction with GST (negative control) or GST-AtWNK8. Inputs and precipitated proteins were analyzed by immunoblot analysis using an anti-AtRGS1 antibody. (D) In vitro phosphorylation of AtRGS1 by AtWNK8. Recombinant His-tagged RGSbox+Cterm, RGSbox, or GST-AtRGS1-Cterm plus γ32P-ATP were incubated with (WNK8) or without (−) GST-AtWNK8. Radiolabelled (32P) proteins were separated by SDS-PAGE and detected as described in the Methods. (E) The levels of phosphorylation were quantified. Error bars = SEM, n = 3. **, P < 0.01. (F) In vivo phosphorylation of AtRGS1. Seedlings expressing AtRGS1-TAP were pretreated with 100 nM calyculin A for 3 h followed by 6% D-glucose for 90 min. Phosphorylation of AtRGS1 was detected by immunoblot analysis using an anti-phospho-AtRGS1 antibody or peroxidase anti-peroxidase (Total RGS1). (G) In vivo phosphorylation of AtRGS1 or the ΔCtSA mutant. TAP-tagged AtRGS1 or AtRGS1-ΔCtSA seedlings were pretreated with 100 nM calyculin A or 10 mM sodium orthovanadate for 3 h followed by 6% D-glucose stimulation for 90 min. AtRGS1 or AtRGS1-ΔCtSA lysates was separated by 12.5% Anderson’s gel and subjected to immunoblot analysis using anti-phospho-AtRGS1 antibody or peroxidase anti-peroxidase (Total RGS1, RGS1ΔCtSA). (H) Internalization of AtRGS1-YFP and AtRGS1-3×SA-YFP. AtRGS1-YFP and AtRGS1-3×SA-YFP were transiently expressed, followed by 30 min treatment in 6% glucose prior to imaging. Scale bars = 10 µm. (I) Quantitation of AtRGS1-YFP and AtRGS1-3×SA-YFP fluorescence internalization. Error = SEM, n = 5. (J) Internalization of full-length and carboxyl-terminal truncated mutant of AtRGS1. AtRGS1-YFP or AtRGS1-ΔCtSA was expressed in tobacco leaves and treated with 6% D-glucose for 30 min. WNK8 denotes AtWNK8. Scale bars = 20 µm. Quantitation of fluorescence is described in Methods.

