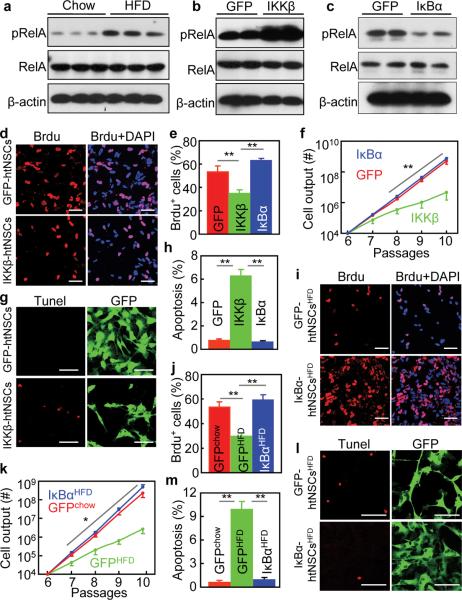
Figure 5.
Impaired in vitro proliferation of htNSCs with IKKβ/NF-κB activation. (a) Adult C57BL/6 mice were fed on a chow vs. HFD for 4 months. Hypothalamic neurospheres were generated from these mice, cultured and passaged in vitro. Western blotting was performed for cultured neurospheric cells to measure phosphorylated RelA (pRelA). RelA and β-actin were analyzed as controls.
(b,c) Neurospheres were derived from the hypothalamus of chow-fed C57BL/6 mice (3 months old). Dissociated neurospheric were infected with lentiviruses expressing CAIKKβ (GFP-conjugated), DNIκBα (GFP-conjugated), and GFP. In vitro models of htNSCs with stable transduction of GFP, CAIKKβ and DNIκBα were established and maintained in the selection medium, named GFP-htNSCs, IKKβ-htNSCs and IκBα-htNSCs (Suppl. Fig. 7), respectively. Cells were analyzed via Western blots for pRelA. Total protein levels of RelA and β-actin were analyzed as controls.
(d–h) Dissociated IKKβ-htNSCs, IκBα-htNSCs, and GFP-htNSCs were maintained in the growth medium. (d,e) Cells (Passage 6) were labeled with Brdu and analyzed for Brdu-positive (Brdu+) cells. (f) Cell outputs over subsequent 4 passages were analyzed. (g,h) Cells (Passage 6) were subjected to Tunel staining, and Tunel staining-positive cells were counted.
(i–m) Neurospheres derived from the hypothalamus of C57BL/6 mice that received a normal chow vs. HFD for 4 months. Dissociated neurospheric cells were infected with lentiviruses expressing DNIκBα (GFP-conjugated) or GFP to establish IκBα-htNSCsHFD, GFP-htNSCsHFD, and GFP-htNSCschow lines. Dissociated cells with the same initial cell numbers from Passage 6 were maintained in the growth medium. (i,j) Cells (Passage 6) were pulse labeled with Brdu, and Brdu-positive (Brdu+) cells were analyzed. (k) Cell outputs from the same initial number at Passage 6 were followed for 4 passages. (l,m) Tunel assay was performed for cells (Passage 6, Day 2) and analyzed using Tunel staining.
(b,c,e,f,h) IKKβ: IKKβ-htNSCs; IκBα: IκBα-htNSCs; GFP: GFP-htNSCs
* P < 0.05, ** P < 0.01, *** P < 0.001, n = 4 (e,f,h,k), n = 5 (j) and n = 6 (m) per group. Error bars reflect means ± s.e.m. Statistics in (f,k): data points in red or blue lines were compared to the corresponding points in green line. Scale bar = 50 μm (d,g,i,l).

