Figure 4.
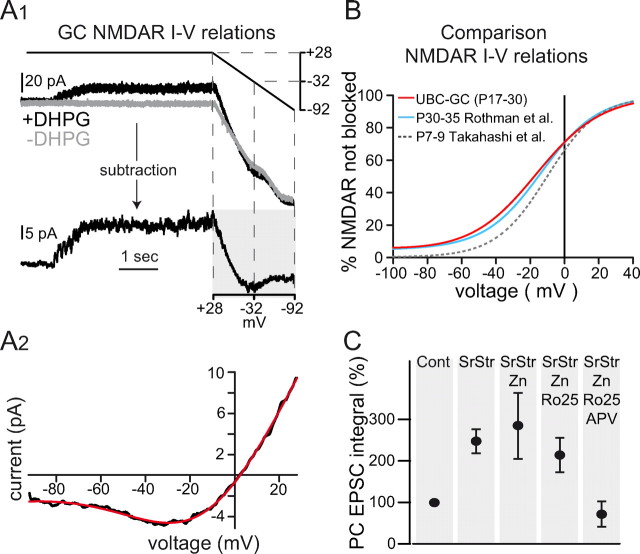
GC NMDARs have a weak voltage dependence, and a pharmacological profile of GC layer transmission consistent with GluN2C-containing receptors. A1, DHPG-evoked GC NMDAR EPSCs isolated by bath application of 5 μm NBQX. The GC membrane potential was ramped from +28 to −92 mV with (top, black) and without (gray) evoking NMDAR currents by DHPG stimulation. Subtraction of the two current responses revealed the NMDAR current–voltage relationship (bottom, shaded region). A2, Resulting current–voltage relationship from shaded region in A1 (black) and a fit to Equation 1 (red): GNMDAR = 401.7 pS, ENMDAR = 2.4 mV, C1 = 3.70 mm, C2 = 0.033 mm, δbind = 0.34, δperm = 0.47 (T = 33°C; [Mg2+]out = 1.5 mm), where C1 = koff/kon and C2 = kperm/kon. B, Fraction of NMDARs not blocked m(V) from the fit in A2 (red curve). Blue curve shows fit of Equation 1 to GC NMDAR currents evoked by direct MF stimulation: GNMDAR = 367.9 pS, C1 = 2.07 mm, C2 = 0.015 mm, δbind = 0.35, δperm = 0.53 (T = 35°C; [Mg2+]out = 1.0 mm; ENMDAR constrained to 0 mV; data from Rothman et al., 2009). Gray dashed curve shows a simultaneous fit of Equation 1 to the P7–P9 wild-type GC data of Takahashi et al. (1996) using both 0.1 and 1.0 mm [Mg2+]out data: C1 = 1.97 mm, C2 = 0.0035 mm, δbind = 0.43, δperm = 0.48, average GNMDAR = 952.6 pS, ENMDAR = 10.28 mV (T = 24.5°C). For comparison, m(−80 mV) = 7.8, 7.0, and 1.4% for the 3 respective curves. C, Normalized charge integral of the PC synaptic response after application of SR and Str, zinc (Zn), Ro25-6981 (Ro-25), and APV. Tricine (10 μm) was included in all conditions to buffer free zinc.

