
Figure 5.
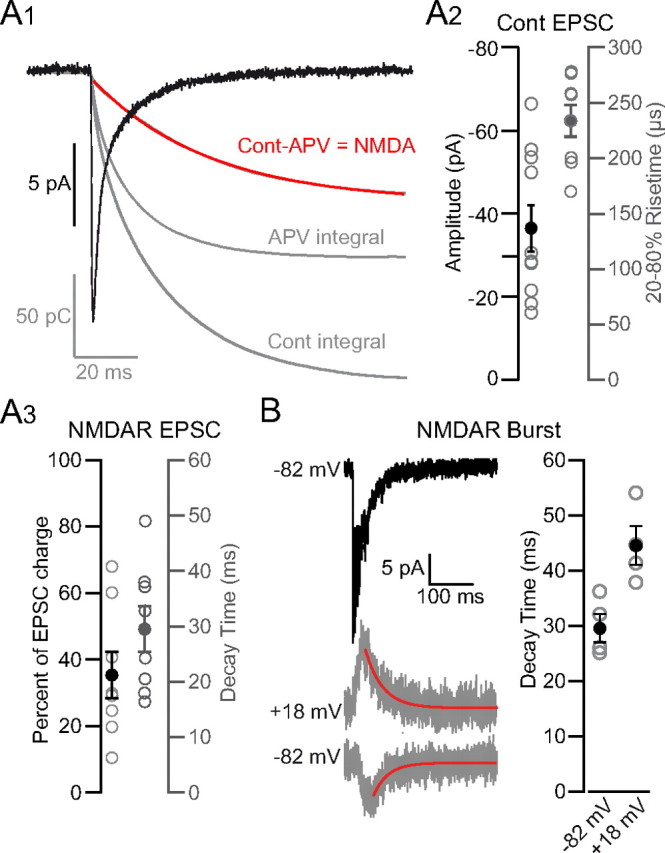
Amplitude and kinetics of AMPAR and NMDAR components of UBC MF-GC EPSCs. A1, GC EPSC recorded at −82 mV during DHPG stimulation obtained by averaging synaptic events isolated by >100 ms (black trace). The EPSC integrals in control and APV are shown in gray. Subtraction of the integral in APV from the integral in control conditions gives the kinetics of charge due to NMDARs, which is fit with a single exponential (red trace). A2, Amplitude (left) and 20–80% rise time constant (right) of EPSCs isolated by >100 ms. Filled circles represent the average value. A3, Percentage of the total charge carried by NMDARs (left). Decay time constant of the NMDAR component (right). B, Top, EPSC burst recorded at −82 mV. Bottom, NMDAR bursts isolated with NBQX at +18 and −82 mV and a single exponential fit (red trace). Right, Decay time constant of NMDAR component determined from isolated bursts.