
Figure 8.
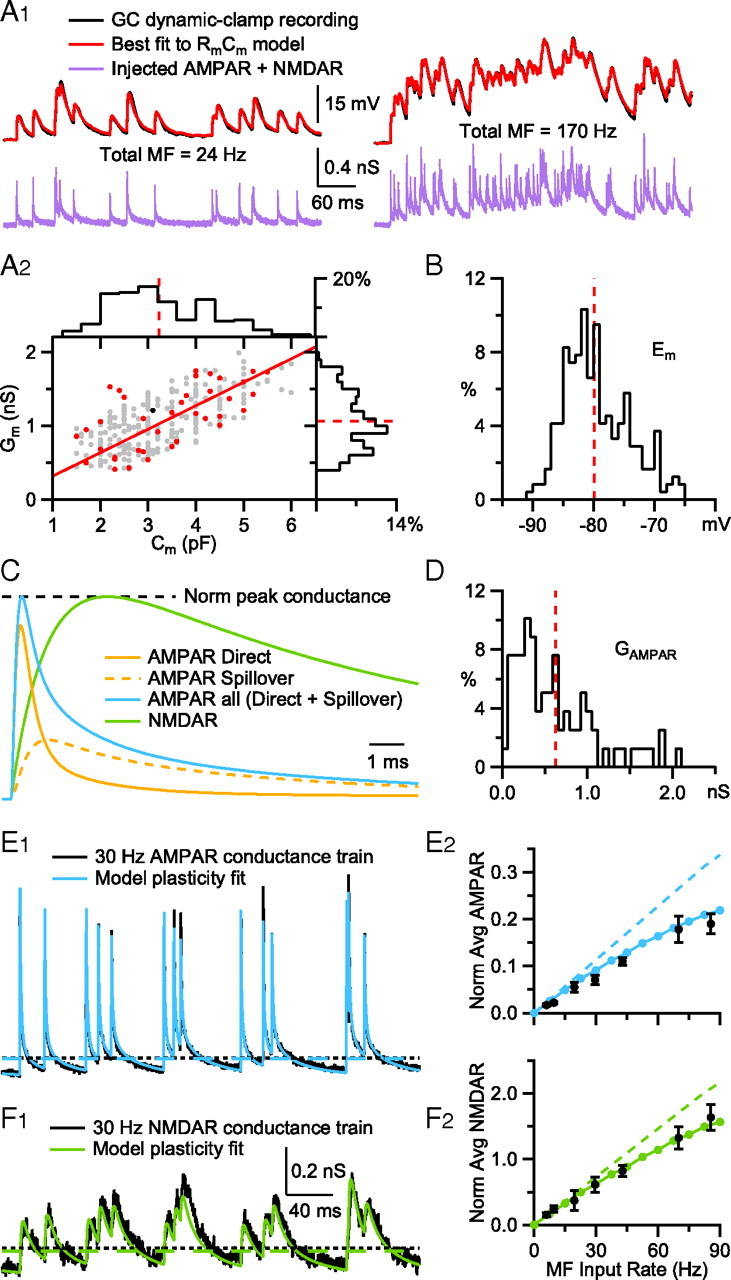
Conductance-based integrate-and-fire models mimic heterogeneity in GC membrane properties and MF synaptic input. A1, A simple RmCm model fit (red; Eq. 3) to the subthreshold voltage trajectory of a GC (black) during injection of a synaptic conductance train (purple) injected via dynamic clamp. The injected conductance train consisted of the sum of 4 different MF inputs, for a sum total rate (Total MF) of 24 Hz (left) and 170 Hz (right). Similar fits were computed for 37 other GCs (data not shown). Data from Rothman et al. (2009). A2, Relationship between membrane conductance (Gm; estimated from RmCm model fits as in A1, red circles; black circle denotes GC in A1) and membrane capacitance (Cm measured in voltage clamp) for 38 GCs, together with a linear fit (red line; Gm = Cm · 318.6 pS/pF; R2 = 0.89, p < 0.001). Gray symbols show passive properties for 204 additional GCs, estimated using their experimentally measured Cm and the linear relation and the residual distribution (differences between the line fit and data points, which were well described by a normal distribution between −0.5 and 0.5 nS; data not shown) to generate appropriate Gm values. Histograms show distributions of Cm and Gm for the full GC population in bins of 0.4 pF and 0.1 nS, with average values (red dashed lines; 3.22 ± 1.02 pF and 1.06 ± 0.37 nS). B, Membrane reversal potential (Em) measured from 242 GCs in the presence of inhibitory blockers. Dashed line denotes average (−79.9 ± 5.3 mV). C, Time course of model AMPAR conductance (AMPAR all, blue; Eq. 5; peak normalized to one) and underlying spillover (dashed orange) and direct (solid orange) components with a peak ratio of 0.34. The 10–90% rise times of the direct, spillover and summed components were 0.17, 0.57, and 0.17 ms, respectively, as in the work of DiGregorio et al. (2002). The decay of “AMPAR all” was fit by a double-exponential function with fast and slow components (A1 = 74%, τ1 = 1.15, A2 = 24%, τ2 = 9.71) that closely matched those of the isolated AMPAR currents in this study. The model NMDAR conductance waveform (green, NMDAR; Eq. 5; peak normalized to one) had a 10–90% rise time of 1.4 ms, which matches that of NMDAR EPSCs recorded at MF-GC synapses (n = 4; data from Rothman et al., 2009), and a single-exponential decay time constant of 24.7 ms, which matches that of the isolated NMDAR currents in this study (Fig. 5B). D, Distribution of mean peak AMPAR conductances (GAMPAR) for single MF synapses. Dashed line denotes average (0.63 ± 0.48 nS, n = 79). Data from Sargent et al. (2005), their Figure 1C. E1, Fit of the plasticity model (blue; Eq. 6) to a 30 Hz MF-GC AMPAR conductance train (black). The fitting routine minimized the sum of squared residuals of the two conductance trains, not the peak amplitudes. Dashed lines denote time-averaged conductance values for the data (black) and fit (blue) measured at t >100 ms from the onset of synaptic input. Data from Rothman et al. (2009). E2, Time-averaged AMPAR conductance (dashed lines in E1) as a function of the input rate of a single MF, for real GCs (black circles; n = 4; SEM; Rothman et al., 2009) and the synaptic model (blue circles). Conductance trains were normalized so the amplitude of the first synaptic input equaled one. For comparison, model gAMPAR with no plasticity is shown as the dashed line. F1 and F2, Same as E1 and E2, but for the unblocked NMDAR conductance (green). Data in F1 were low-passed filtered at 1 kHz for presentation.