
Figure 9.
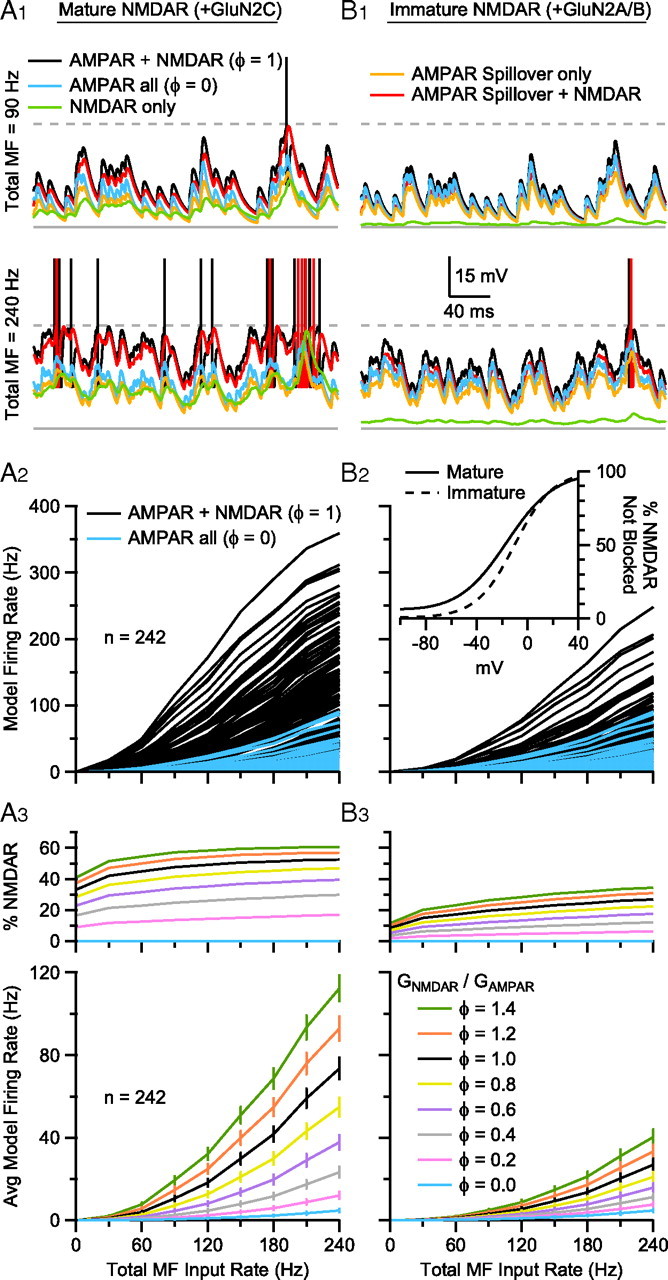
Incomplete Mg2+ block of GluN2C-containing NMDARs enhances AP firing in GC models during low-frequency MF input. A1, Voltage traces from a GC model with mid-range membrane properties (Cm = 3.0 pF, Gm = 1.1 nS, Em = −80 mV) during excitation with 4 asynchronous MF inputs with total input rate of 90 Hz (top) and 240 Hz (bottom) under different input conditions: AMPAR + NMDAR (black; φ = 1.0), AMPAR all (blue; φ = 0), NMDAR only (green), AMPAR spillover only (orange), AMPAR spillover + NMDAR (red). Resting potential was −77.9 mV (solid gray line). AP threshold was −40 mV (dashed gray line); APs truncated to −15 mV. A2, Steady-state input-output relationships (GC firing rate vs total MF input rate) for 242 GC models with different Cm, Gm, Em, and synaptic properties (Fig. 8). To construct the input-output relationships, each GC was driven by 4 statistically independent random MF synaptic conductance trains, with the same mean frequency, and this frequency was then varied between 7.5 and 60 Hz. The blue traces show GC input-output relations for AMPAR only MF inputs, while MF inputs with both AMPAR and NMDAR components are shown in black. The voltage dependence of the NMDAR conductance was set to that for mature GCs (B2 inset, solid line) that express GluN2C. φ denotes the ratio of GNMDAR to GAMPAR, such that for AMPAR only, φ = 0 and for AMPAR plus NMDAR components, φ = 1.0. These ratios were the same across all 4 MF inputs. A3, Average input-output relations of the 242 GC models in A2 (blue and black) plus simulations for other φ in the range 0–1.4. Error bars denote SEM. Top graph shows the percentage of the total synaptic current injected into the GC models mediated by NMDARs. B1, B2, and B3, The same as A1, A2, and A3, except the NMDAR voltage-dependent block was that of immature GCs (B2 inset, dashed line) that express GluN2A/B. B2 inset, Fraction of NMDARs not blocked as a function of voltage (m(V); Eq. 2). Solid line is from a fit to the GC data in Figure 4A2. Dashed line is from a fit to the P7–P9 wild-type GC data of Takahashi et al., 1996, shown in Figure 4B.