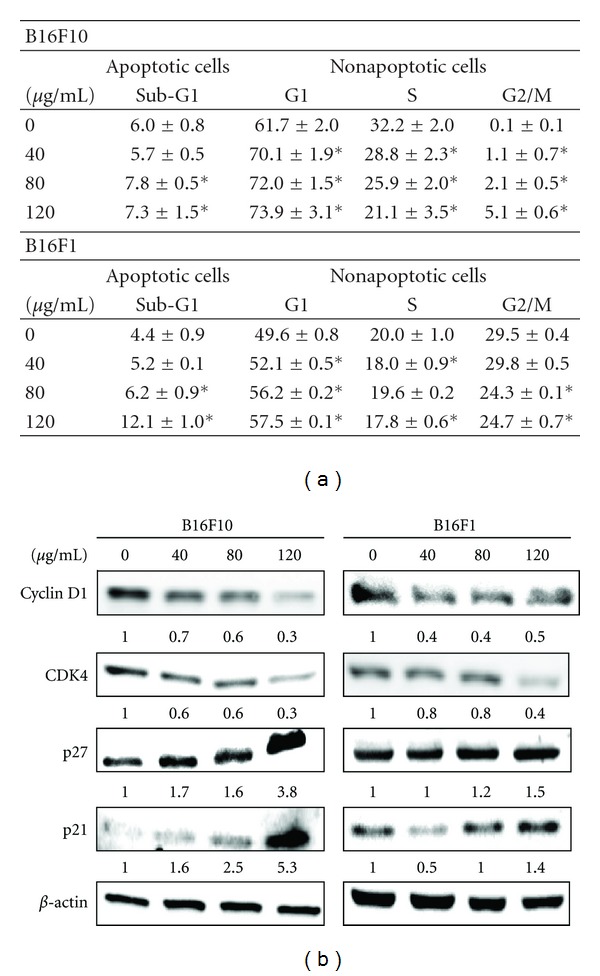
Figure 4.

AC caused G1/S cell cycle arrest in melanoma cells. (a) B16F10 and B16F1 cells were treated with or without AC (40–120 μg/mL) for 24 h, stained with PI, and the cell cycle phase was analyzed using flow cytometry. Cellular distribution (percentage) in various phases of the cell cycle (sub-G1, G1, S, and G2/M) after treatment with AC was measured. Numerical data of representative flow cytometry patterns are shown. The results are presented as the mean ± S.D of three independent assays. *Significant difference in comparison to the control versus sample group (P < 0.05). (b) B16F10 and B16F1 cells were treated with AC (40–120 μg/mL) for 24 h. Western blot analysis of the protein levels of cyclin D1, CDK4, p27, p21, and β-actin was measured. A total of 50 μg of denatured protein samples was resolved by 8–15% SDS-PAGE. The photomicrographs shown in this figure are from one representative experiment performed in triplicate, with similar results.
