Figure 5.
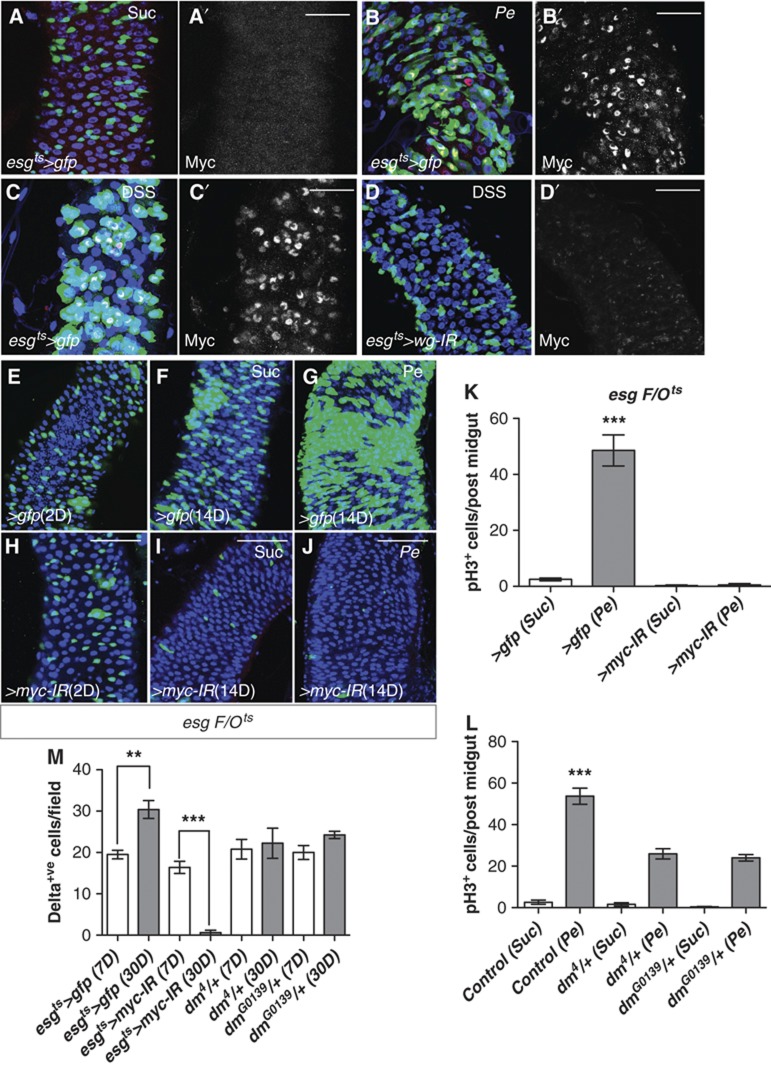
Myc is activated downstream of Wg during regeneration. (A–D′) Midguts of the indicated genotypes treated with Suc (A, A′), Pe (B, B′) or DSS (C–D′) and stained with anti-MYC (red in left panels and grey in right panels). Note the upregulation of Myc during regeneration (compare B′, C′ with A′), which is prevented by Wg knockdown in esg+ve cells (compare D′ with C′). (E–J) esgts>F/O midguts expressing gfp (E–G) or RNAi for myc (H–J) at 2 and 14 days after clone induction and treated with Suc or Pe. Note the reduced number of esg-derived clones upon time during homeostatic conditions (compare I with F) and the complete block in the response to damage when myc is knocked down (compare J with G). (K, L) Quantification of pH3+ve cells in posterior midguts of the indicated genotypes and treatments. Note the complete block in proliferation by myc knockdown (K), and the halved proliferation rates in regenerative conditions by myc heterozygosity (L) (***P<0.0001 one-way ANOVA with Bonferroni’s multiple comparison test). (M) Quantification of Delta+ve ISCs in posterior midguts of the indicated genotypes and age. Note the loss of Delta+ve ISCs after 30 versus 7 days of myc knockdown in progenitor cells (esgts>myc-IR) but not in age-matched myc heterozygotes (***P<0.0001 Student’s t-test). As indicated in the previous figure, Delta+ve values from control (esgts>gfp) midguts presented here for reference are the same as shown in Figure 3M. Unlike controls, myc heterozygotes midguts did not display increase in number of ISC over time (**P<0.005 Student’s t-test). Sale bars: 40 μm (A–D′); 50 μm (E–J).

