
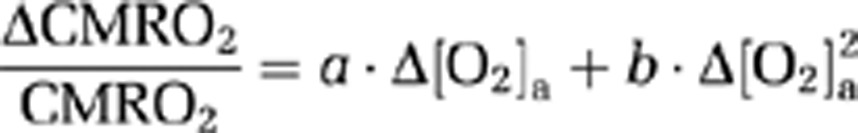
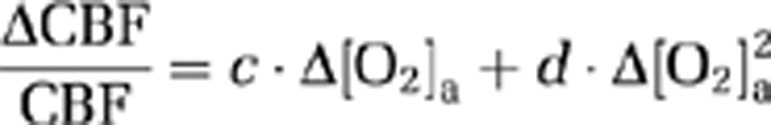
Table 3. Coefficient values and their confidence intervals describing the dependence of CMRO2 and CBF on Δ[O2]a.
|
|
|||||
|---|---|---|---|---|---|---|
| Coefficient | a | b | c | d | ||
| Value | −0.15 | −0.056 | −0.046 | 0.038 | ||
| 95% CILL | −0.17 | −0.095 | −0.073 | 0.0052 | ||
| 95% CIUL | −0.12 | −0.017 | −0.019 | 0.071 | ||
| P value | <0.001 | 0.007 | 0.002 | 0.025 | ||
CILL, confident interval lower limit; CIUL, confident interval upper limit; CBF, cerebral blood flow; CMRO2, cerebral metabolic rate of O2.