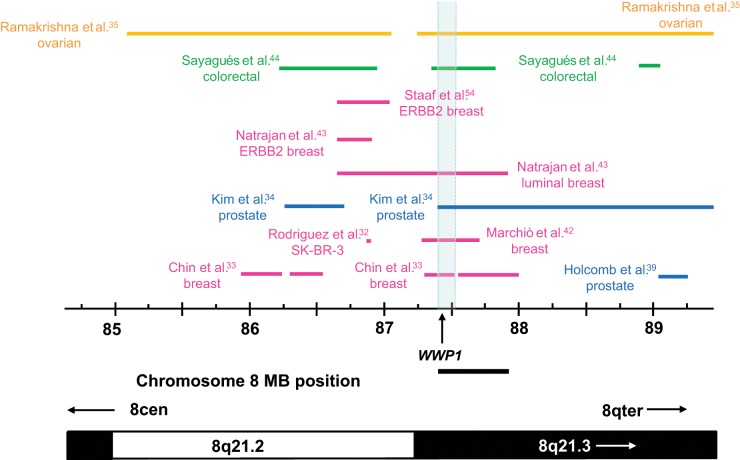
Figure 4.
Summary of chromosome 8q21.2-q21.3 copy number gains in cancer tissues or cell lines. Gained regions are indicated using horizontal lines according to the chromosome 8 coordinates below (in Mb), with the corresponding cytogenetic bands indicated on the lower ideogram. Arrows within cytogenetic bands indicate that these extend beyond the region shown. The study reporting each gained region is indicated to the left or right, with colored lines and text highlighting studies examining particular cancer types. The minimal region of overlap (supported by 6 studies) is shaded in light blue and includes the proposed amplification target gene WWP1, the 5′ position of which is shown using a vertical arrow. The position of the minimally gained region identified through the consideration of gains of at least 1 Mb in length (Fig. 1) is shown as a horizontal bar below the chromosome 8 coordinate scale.

