
Figure 2.
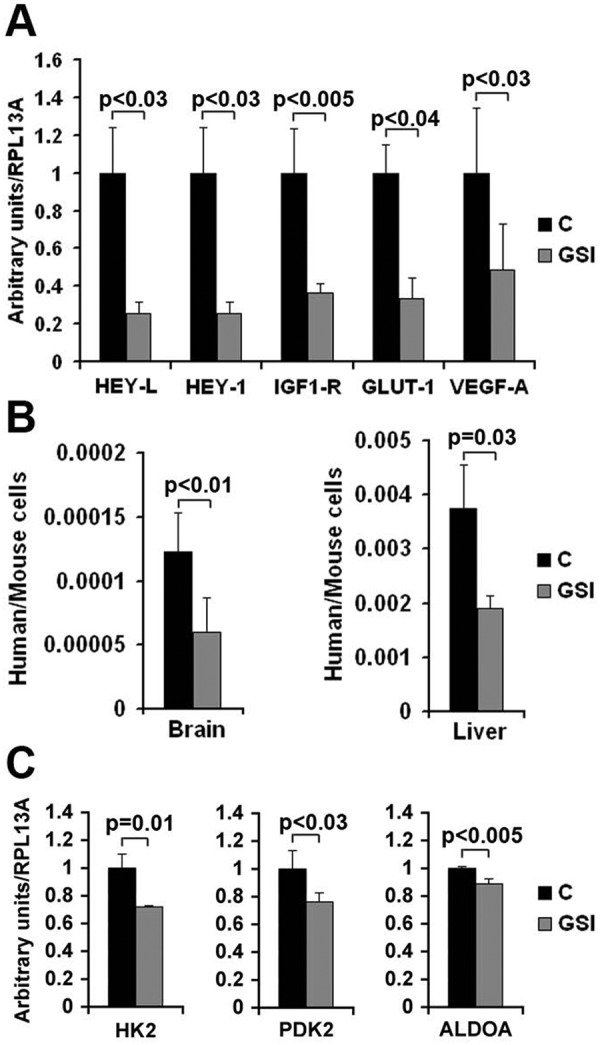
Measurement of the indicated mRNAs (A and C) or ratio of cells (B) in control or GSI-treated mice. (A) Total RNA was isolated from the whole left lung of mice after euthanasia, reverse transcribed, and measured by Q-PCR using human-specific primers. The results were normalized for human ribosomal protein RPL13A. Columns represent averages, while bars represent standard deviation. The experiment was performed on 4 control and 4 MRK-003 treated mice. (B) Ratio of human versus mouse cells in the indicated organs in control mice (C) and in MRK-003 treated mice (GSI). This ratio was calculated by Q-PCR using primers specific for human or mouse GAPDH (this Q-PCR assay has been previously validated using known amount of cells). In the brain experiment, columns represent the average of 6 mice (controls: days at euthanasia 12.67 ± 4.18; GSI treated mice: days at euthanasia 17.83 ± 8.86). In the liver experiment we analyzed 6 control mice (days at euthanasia: 12.6 ± 4.22) and 7 GSI treated mice (days at euthanasia: 18.67 ± 7.84). Bars represent standard deviation. (C). RT-Q-PCR of the indicated mRNA in control (C) or MRK-003 treated mice (GSI). Columns represent the average of 4 mice. Bars represent standard deviation. P values are indicated.