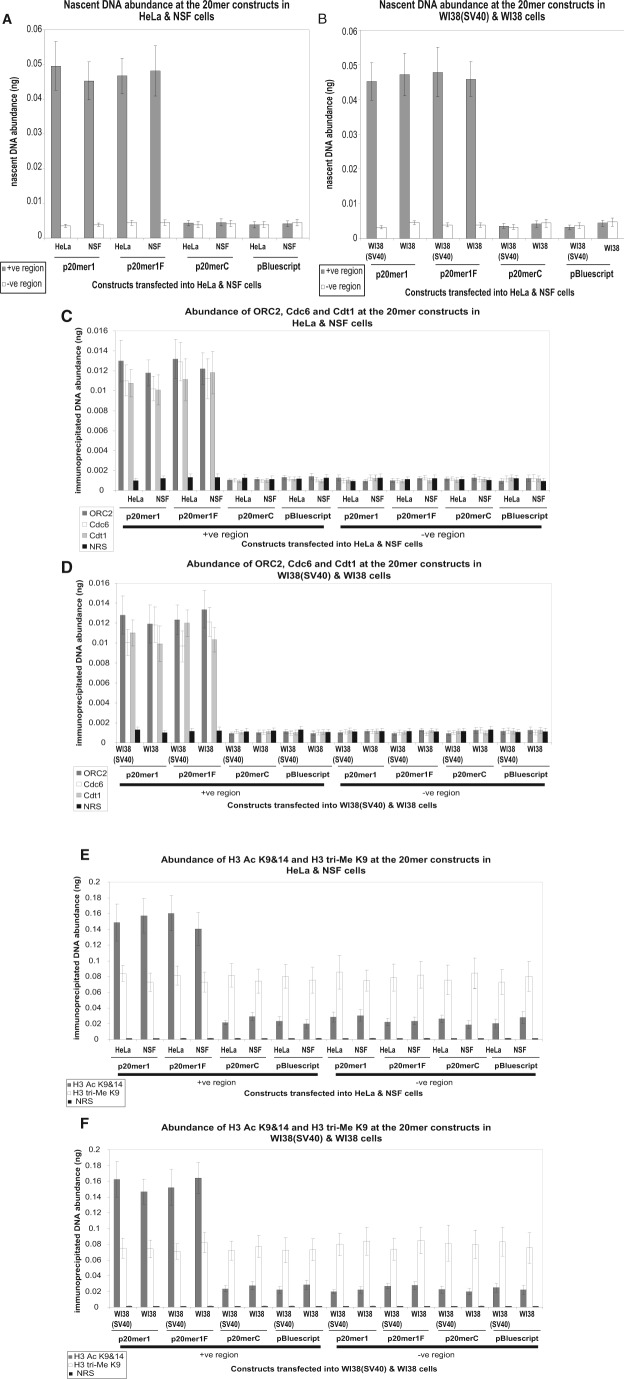
Figure 2.
(A, B) Comparative analysis of episomal nascent DNA abundance in transformed and normal cells. Histogram plots of the quantification by real-time PCR of nascent DNA abundance (ng) at the p20mer1, p20mer1F, p20merC, and pBluescript episomal constructs in the transformed cell line {HeLa} and normal cell line {NSF} (A) and in the transformed cell line {WI38(SV40)} and normal cell line {WI38} (B). The location and sequence information of the primers used for the amplification of the +ve region with insert (gray bars) and the −ve region without insert (white bars) are as described in Suppl. Table 4. The error bars represent the average of at least 2 experiments performed in triplicate and 1 standard deviation. (C, D) In vivo association of ORC2, Cdc6, and Cdt1 with episomal constructs in transformed and normal cells. Histogram plots of the quantification by real-time PCR of immunoprecipitated DNA abundance (ng) at the p20mer1, p20mer1F, p20merC, and pBluescript episomal constructs in the transformed cell line {HeLa} and normal cell line {NSF} (C) and in the transformed cell line {WI38(SV40)} and normal cell line {WI38} (D). ChIP was performed with antibodies directed against ORC2 (dark gray bars), Cdc6 (white bars), and Cdt1 (light gray bars); normal rabbit serum (NRS) (black bars) was used as a negative control. The primer sets of the +ve region and the −ve region are as described in Suppl. Table 4. The error bars represent the average of at least 2 experiments performed in triplicate and 1 standard deviation. (E, F) In vivo association of histone H3 Ac K9&14 and histone H3 tri-Me K9 with episomal constructs in transformed and normal cells. Histogram plots of the quantification by real-time PCR of immunoprecipitated DNA abundance (ng) at the p20mer1, p20mer1F, p20merC, and pBluescript episomal constructs in the transformed cell line {HeLa} and normal cell line {NSF} (E) and in the transformed cell line {WI38(SV40)} and normal cell line {WI38} (F). ChIP was performed with antibodies directed against histone H3 Ac K9&14 (dark gray bars) and histone H3 tri-Me K9 (white bars); NRS (black bars) was used as a negative control. The primer sets of the +ve region and the −ve region are as described in Suppl. Table 4. The error bars represent the average of at least 2 experiments performed in triplicate and 1 standard deviation.

