
Figure 5.
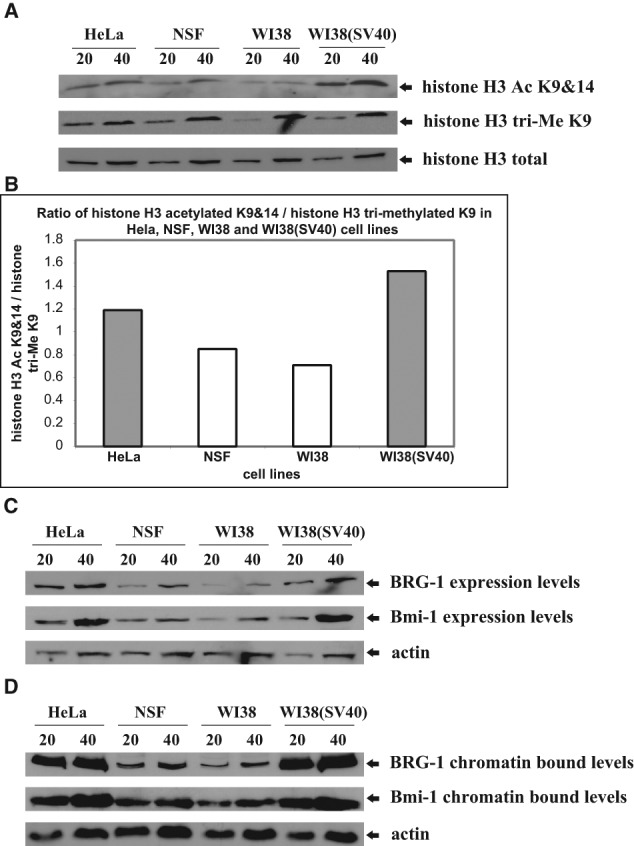
Comparative analysis of the expression and chromatin-bound levels of histone H3 Ac K9&14, histone H3 tri-Me K9, Brg-1, and Bmi-1 in transformed and normal cells. (A) Total histone acid extracted levels of histone H3 Ac K9&14 and histone H3 tri-Me K9 in the 2 transformed {HeLa and WI38(SV40)} and 2 normal {NSF and WI38} cell lines. We subjected 20 and 40 µg of histone acid extracts to SDS-PAGE, transferred them onto PVDF membrane, and probed them with anti-histone H3 Ac K9&14 and anti-histone H3 tri-Me K9 antibodies. Anti-histone H3 total was used as a loading control. (B) Histogram plot representing the ratio of histone H3 Ac K9&14 to histone H3 tri-Me K9 in the 2 transformed {HeLa and WI38(SV40)} and 2 normal {NSF and WI38} cell lines. (C) Expression levels of Brg-1 and Bmi-1 in the 2 transformed {HeLa and WI38(SV40)} and 2 normal {NSF and WI38} cell lines. We subjected 20 and 40 µg of whole cell extracts to SDS-PAGE, transferred them onto PVDF membrane, and probed them with anti-Brg-1 and anti-Bmi-1 antibodies. Anti-actin was used as a loading control. (D) Chromatin bound levels of Brg-1 and Bmi-1 in the 2 transformed {HeLa and WI38(SV40)} and 2 normal {NSF and WI38} cell lines. We subjected 20 and 40 µg of chromatin-bound extracts to SDS-PAGE, transferred them onto PVDF membrane, and probed them with anti-Brg-1 and anti-Bmi-1 antibodies. Anti-actin was used as a loading control.