
Figure 1.
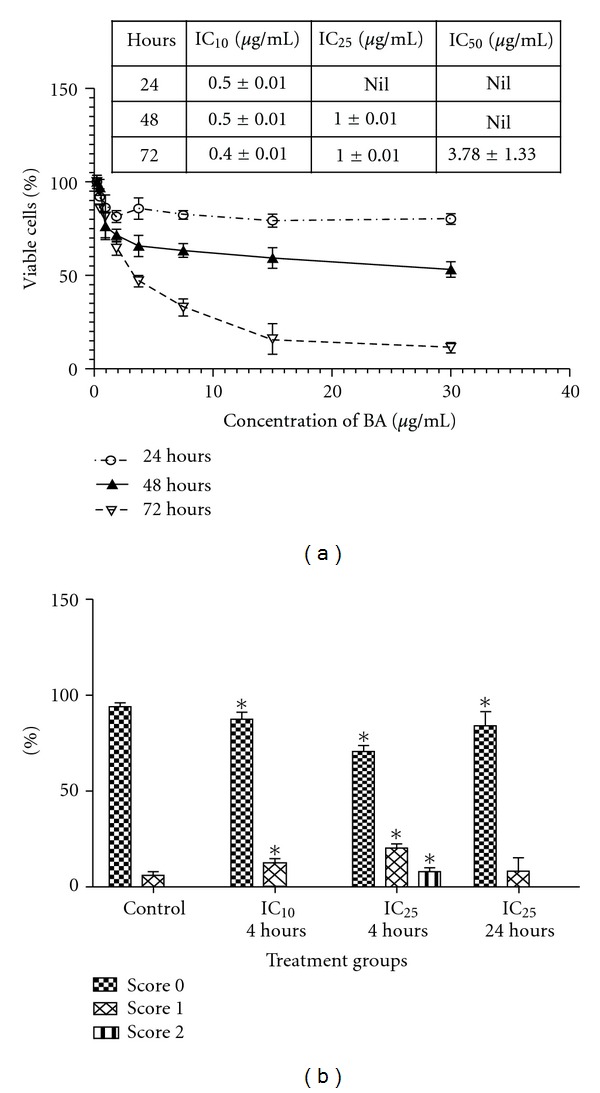
(a) Cell viability after 24 h, 48 h, and 72 h exposure of VSMCs to BA. The data are expressed as a percentage of the control value (value obtained for untreated cells) and the table indicates value of inhibitory concentration at 24 h, 48 h and 72 h. (b) DNA damage scoring following treatment with IC10 and IC25 of BA for 4 h and 24 h. The results were obtained from three individual experiments. Error bars denote SD *P < 0.05 (Student's-t test).