
Figure 2.
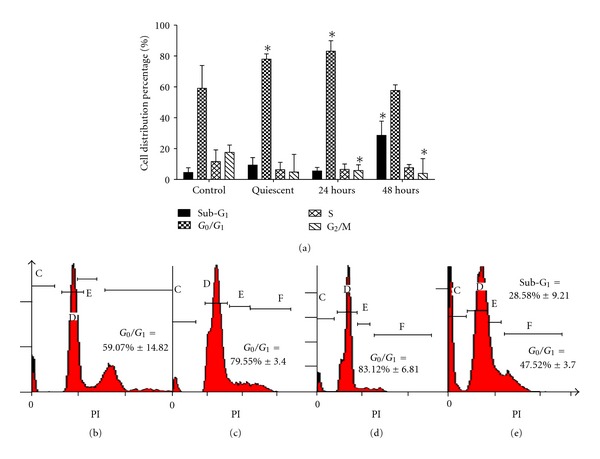
The distribution of VSMCs cell cycle phases after BA treatment at IC50 = 3.8 μg/mL for 24 hand 48 h. The results shown are mean ± SD P < 0.05 versus control in 3 different experiment (Student's-t test). Representative flow cytometry diagram of cell cycle progression for (b) untreated, (c) quiescent treated, (d) IC50 BA treated (24 h), and (e) IC50 BA treated (48 h) VSMCs.